


Unveiling the Gold Market’s Working Parts
Commodities / Gold and Silver 2013 May 23, 2013 - 12:53 PM GMTBy: Jan_Skoyles

 Why this happened is something which is open to much analysis and theorising. For the mainstream media it was down to an improving global economy and the need to hold gold no longer existed, for those in the world of gold investment this was perhaps down to more of the politics behind the gold-market than the economics.
On April 12th 3.4 million ounces (100 tonnes) of gold was sold in the US futures markets. This was just for starters, the main, side and dessert appeared over the following hours and the next session on the Chicago Mercantile Exchange (COMEX).
Reacting to the gold price smash
As those in the West holding paper gold stood frozen watching the price tick further downwards, those in the East and others looking to buy physical gold, went on a shopping spree. Premiums on physical gold in China, India, Vietnam and across Asia hit highs associated with economic and geopolitical crises. Dealers struggled to keep up with demand.
In the four weeks to April 24th reported inventories of ETFs, funds, and futures market depositories collapsed by over 5.5 million ounces ($7 billion).
The largest physical removals were reported by the COMEX of 1.4 million ounces and the SPDR Gold Trust (GLD), which reported total inventory removal of nearly 4 million ounces.
In their Q1 report, the World Gold Council referred to the ‘dichotomous nature’ of the gold market – this is clear as the paper gold market continues to tell a different story to the physical market.
Today we continue to see ETF outflows and COMEX gold futures have fallen once again this week. Meanwhile, premiums on physical gold in Hong Kong have climbed to $5 per ounce, having been $3 last week, whilst traders in Japan are pushing premiums up in response to Chinese gold demand.
As the President and Executive Chairman of CME Group, Terrence Duffy, told Bloomberg following the April’s gold price fall: “What’s interesting about gold, when we had that big break two weeks ago we saw all the gold stocks trade down significantly, we saw all the gold products trade down significantly, but one thing that did not trade down, was gold coins, tangible real gold. That’s going to show you, people don’t want certificates, they don’t want anything else. They want the real product.”
Discussion is focusing on the difference between the paper gold and physical gold markets.
Paper gold versus physical, and where the gold price is set
Since the last gold-bull run in the 1970s, the moving parts of the gold market, and what drives the price, have changed dramatically.
But, what do people really mean when they talk about the ‘paper gold’ and ‘physical’ gold markets?
Gold futures, gold exchange traded products (ETPs) and physical gold are each different ways of gaining exposure to gold. Each form of gold exposure has its relevant gold market segment catering for investors, yet all are priced according to an international gold price.
We thought it was time for a comprehensive look at these different parts of the gold markets, how they interact with each other and establish the gold price itself. After this, we ask what this means for future gold price discovery and meeting gold demand.
The futures market
Futures contracts allow investors to efficiently trade gold, for delivery at a future date – they are one of the most efficient ways to buy gold.
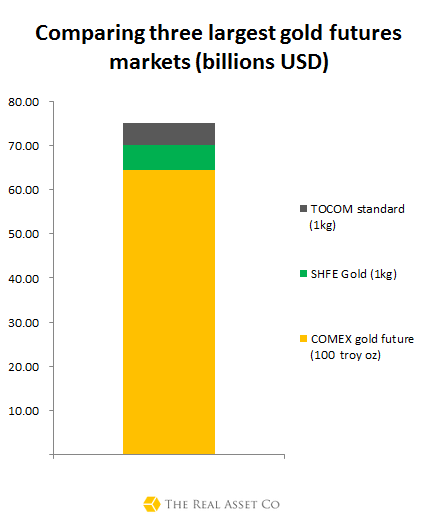
The global gold futures market is worth around $75 billion, with liquidity, in the form of open interest spread, around the world’s major financial exchanges.
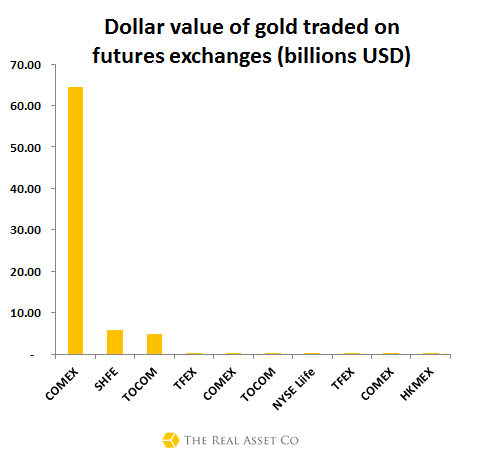
The 100 ounce gold futures contract on the COMEX dominates this activity and accounts for 85% of gold futures trading. COMEX has mild competition from 1kg gold futures contracts traded on the SHFE (Shanghai) and TOCOM (Tokyo) which account for 7% each of the futures market.
There is little doubt over which gold futures market enjoys the liquidity monopoly of these exchanges and thus has the biggest impact on setting the gold price.
This was no better seen than back in April when several large sell orders of the June futures COMEX futures contract appeared on the market, over 120% of annual gold production was traded in one day and the gold price plummeted to levels 30% below the all-time high of $1,920.
The gold futures markets have been operating for decades and are now mature financial markets with deep liquidity, currently jealously guarded by COMEX and the Americans.
Exchange Traded Products
Exchange traded products, or exchange traded funds, allow investors to easily invest in a given asset class by buying shares in a security that tracks the price of the underlying asset. The gold ETP market has grown over the last 12 years to rival other gold market sectors.
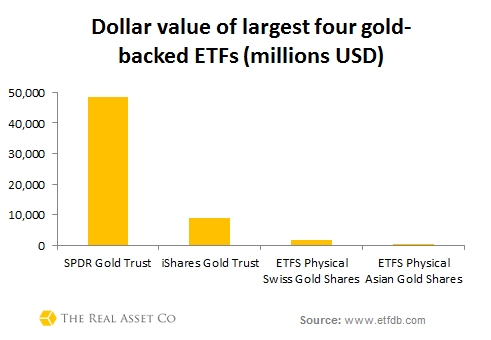
Made up predominantly of gold-backed exchange traded funds, the gold ETP market is worth $81.2 billion. State Street’s SPDR Gold Trust, known by the ticker GLD, accounts for nearly 60% of this market, representing the main liquidity hub within the gold ETP space.
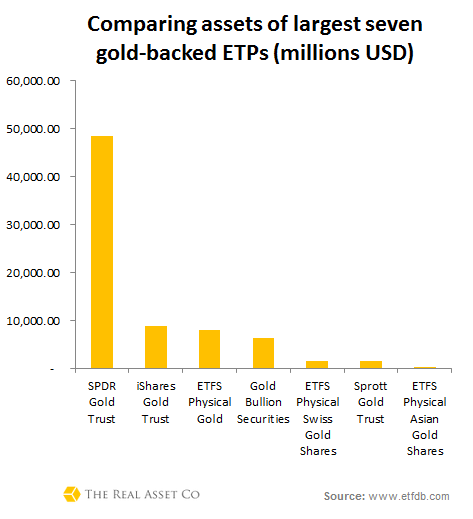
Together, the top physically gold-backed ETF products are worth over $59 billion, of which $48 billion is held by GLD.
In the first quarter of 2013, ETF holdings fell by 176.9 tonnes. The WGC argue that ETFs account for only a small proportion of total gold held by investors – i.e. it is not ETF outflows which are driving the price.
On first impressions, one might assume the futures market is larger than the ETFs market. However, if you compare notional value of open interest in the future market with the market cap of gold ETPs, (taken on 15th May 2013) the newer ETP market just outsizes the futures market with a value of $81 billion, compared to the futures market’s $74 billion.
Refineries and supply to physical gold market
After the two gold market parts above, we arrive at the physical gold market which is supplied by a range of refineries around the world.
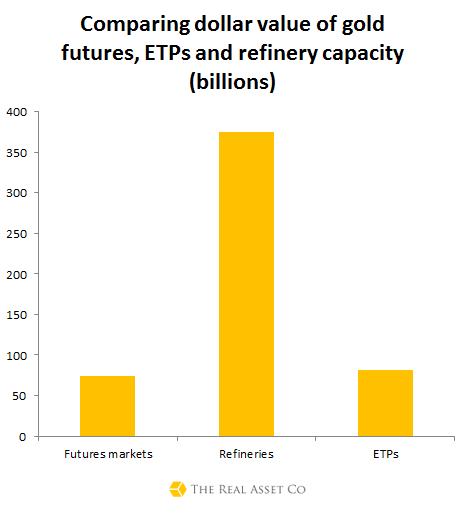
The top refineries in the world have a collective refining capacity of 8000 tonnes, the equivalent to $354 billion. This is assuming that they are able to operate at full capacity and are constantly processing given mine and scrap gold supply.
However, supply of gold bullion to the market is on average 4,400 tonnes per year. This physical gold supply is made up of approximately one third recycled gold, with the rest coming from active gold mines. Supply of gold has remained relatively flat since the start of the gold bull market, twelve years ago, meaning that the world’s growing gold demand has to be serviced by this steady supply
See our infographic of the world’s major gold refineries by capacity below.
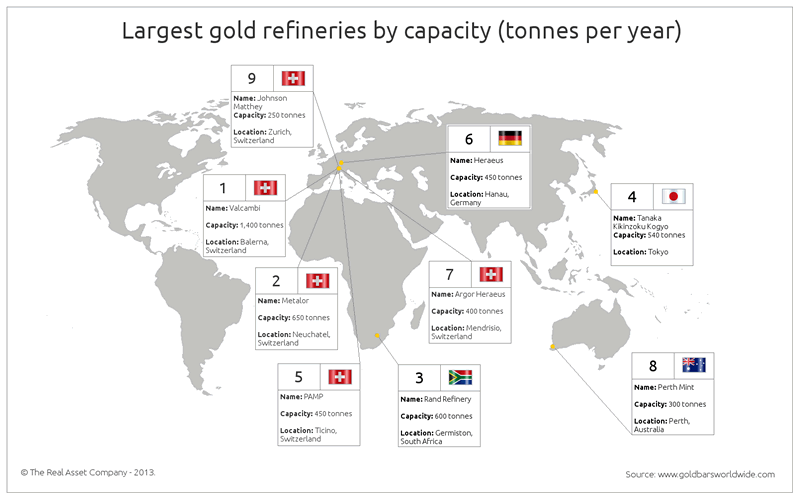
It’s interesting to note Switzerland dominating the gold refining scene. For a country which only officially left the gold standard in 2000 and was the epitome of sound money until quite recently, this is perhaps unsurprising.
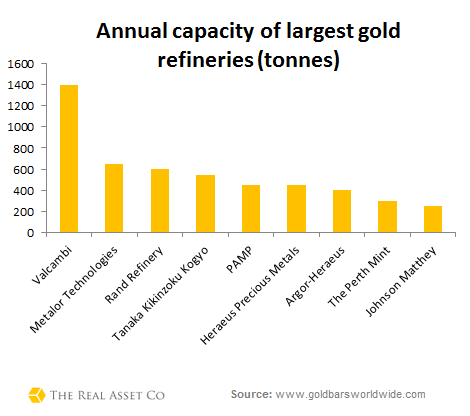
Within the constituency of physical gold suppliers, Switzerland’s Valcambi dominates the gold refining market, followed by Metalor and Rand which are both about half the size. Metalor is also Swiss based, with South Africa’s famous Rand Refinery continuing to hold a position amongst the most noteworthy refineries.
The top three refineries in the world account for over 30% of total annual capacity, of those refineries studied.
| REFINERY | CAPACITY (tonnes/annum) |
| Valcambi | 1,400 |
| Metalor | 650 |
| Rand Refinery | 600 |
| Total: | 2,650 |
Together these three refineries account for 2,650 tonnes or 32% of global gold refining capacity. Valcambi alone represents over 16% of global gold refining capacity and 28% of the capacity of the top nine refineries.
It is important to note the lack of mining and refining information in areas such as South America and China – hence why we don’t mention refineries from these areas.
At first glance the gold production capacity from refineries appears to more than match the value of assets traded in the futures and ETPs markets. The nature of trading in these markets is more difficult to compare though, and the paper markets are where the greatest daily volumes occur.
After looking at the size of the relative gold market constituent parts, we need to look deeper to establish where the gold price really gets set and how this happens.
The physical market, although larger, with its lower turnover and churn is less relevant at this time, with gold prices being set in the paper markets of COMEX, GLD et al.
We are thus focused upon COMEX and GLD, the largest liquidity hubs in their respective markets. How do their trading volumes compare?
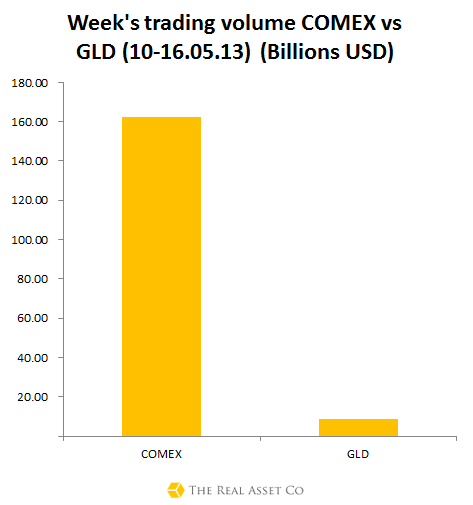
In the last week, the value of the ‘gold’ traded on the COMEX, far exceeded that on the GLD – by over 20 times in fact.
To put this paper trading into perspective, the annual capacity of refineries is $374 billion. Therefore the last week’s gold trading volumes on COMEX were equivalent to 50% of total annual refinery capacity. Half the physical gold that could possibly be refined in a year was traded in paper form this week.
So, whilst the notional value of open interest on the world’s major futures markets is comparable to the market cap of the gold ETP industry, the volumes traded at the major two liquidity hubs within these different market segments is noticeably different.
The dollar value of trading volume at COMEX is far greater than its largest ETF competitor, GLD, meaning that COMEX continues to hold its place as the largest and most sophisticated meeting place for buyers and sellers to express their gold price opinions, in the form of bids and offers, on what the price should be.
COMEX remains the beating heart of gold price discovery.
Questions being raised about COMEX
Gold futures contracts are referred to as ‘paper-gold’ because the size of this market is said to be over 100 times larger than physical gold available. As we said previously, open interest on the COMEX, at the time of writing, accounted for over 85% of demand on the gold futures market, so COMEX receives the most examination here.
In theory investors are able to take delivery of the futures contract on expiry, although few do, instead choosing to roll the contract.
This may not be a bad thing as there is currently only 6 million troy ounces of eligible gold in the COMEX depositories. Whilst these gold inventories would allow delivery against all the May contracts currently traded on COMEX it is only enough to allow delivery against 33% of the June contracts. Contracts spanning May through until August represent 31 million troy ounces of gold, of which less than 5% of these could be delivered upon at current COMEX depository holdings.
Much of the paragraph above assumes futures holders taking delivery of contracts on a larger scale than they currently do. Even so, the fact remains that all the long positions on COMEX cannot be settled in gold.
This may be something that is bothering investors, despite there being few as deeply liquid and efficient market alternatives for large institutional investors.
There has been some attention paid to the scale and pace of draw-downs of COMEX inventories. JP Morgan and Scotia Mocatta have seen the largest outflows of bullion in their repositories. Compared to withdrawals at JP Morgan’s storage facilities of 1.2 million in the first 3 months of 2013, Scotia Mocatta’s drainage of 650,000 ounces seems less remarkable in comparison. Until these recent drawdowns eligible gold stocks at COMEX had been increasing.
The speed and acuteness of recent drawdowns in COMEX inventories – over 2 million ounces since the beginning of the year – suggests that traders are increasingly standing for delivery of their futures position. It is argued that these investors are not exiting the gold market, but simply converting their efficiently entered paper position into physical form.
As notable hedge fund manager, Kyle Bass, once explained, if the notional value of open interest at COMEX is too large compared to physical bullion lying in the COMEX warehouses, then ‘you go get your gold.’ It’s a confidence game… like most financial markets.
In the next few weeks we will look at how sustainable COMEX’s hegemony is, but for now those are the major sections of the global gold market where COMEX remains the Everest for setting the gold price.
Enjoy our research? Get it all delivered to you in our fortnightly newsletter.
Jan Skoyles contributes to the The Real Asset Co research desk. Jan has recently graduated with a First in International Business and Economics. In her final year she developed a keen interest in Austrian economics, Libertarianism and particularly precious metals. The Real Asset Co. is a secure and efficient way to invest precious metals. Clients typically use our platform to build a long position and are using gold and silver bullion as a savings mechanism in the face on currency debasement and devaluations. The Real Asset Co. holds a distinctly Austrian world view and was launched to help savers and investors secure and protect their wealth and purchasing power.
© 2013 Copyright Jan Skoyles - All Rights Reserved Disclaimer: The above is a matter of opinion provided for general information purposes only and is not intended as investment advice. Information and analysis above are derived from sources and utilising methods believed to be reliable, but we cannot accept responsibility for any losses you may incur as a result of this analysis. Individuals should consult with their personal financial advisors.
Jan Skoyles Archive |
© 2005-2022 http://www.MarketOracle.co.uk - The Market Oracle is a FREE Daily Financial Markets Analysis & Forecasting online publication.