Stock Market Update: Buying the Bottom, Badda Bing!
Stock-Markets / US Stock Markets Mar 18, 2008 - 07:50 PM GMTBy: Dominick
 That was easy!! The markets have given us so much of what we've been expecting lately it's impossible to get it all into a single update, but long story short, badda bing badda boo, the main idea is that we were able to buy the low (again) and took the money at our target, which happened to be the high at the close Tuesday. We haven't been giving away as much lately in these free updates, but that doesn't mean we've stopped taking money from this market.

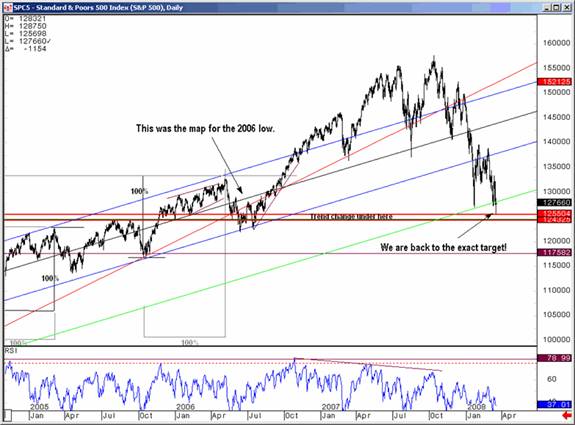
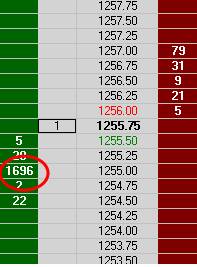
For weeks, members have been aware of the possibility the S&P cash market might have to test the overnight Globex SocGen MLK holiday low. The chart above shows why we had that number at the time back in January and why we were watching it again this week. As you can see, Monday's low was right into our 1256 target. But, when the Bear Sterns news initially popped the futures up into our proprietary 1313 target and turned (exact high was 1314), we knew the failure to launch was a swing sell and it was time to break out the 2006 map. I spent all night Sunday with “the boys” chatting and charting and posting the following screen capture showing bids in the E-mini S&P futures.
 A curious coincidence, the outsized bid at our target? It could have been a bluff, but it was easy to play nonetheless. The trade was to buy 1 tick above with a stop one tick below so if the bid was pulled there was a max 0.5 point of risk. As it turned out, the trade worked and made almost 70 points in a day and a half.
That's shy of $20,000 using one big S&P contract………shy of $100,000 for 5 contracts!!! Price of a TTC membership $129, what are you waiting for? Join now.
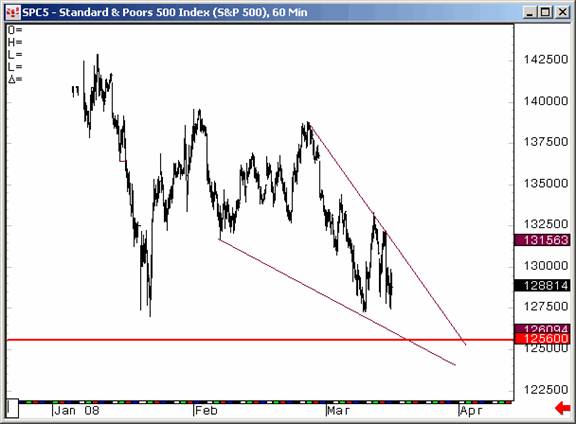
If you can still remember Monday morning after everything that's happened since then, recall that the gap down opening did not take us immediately to the low of the day. In fact, for a while there, the market was moving towards filling the gap. When another one of our proprietary numbers failed, the following chart was posted to reinforce again what I'd been saying for weeks: that the cash market might still have to go down and test that 1256 low.

As you know, the market did exactly that only to reverse powerfully upward into the Fed meeting, where we got a selloff that was snapped up by the smart money and taken up into our target at 1333.

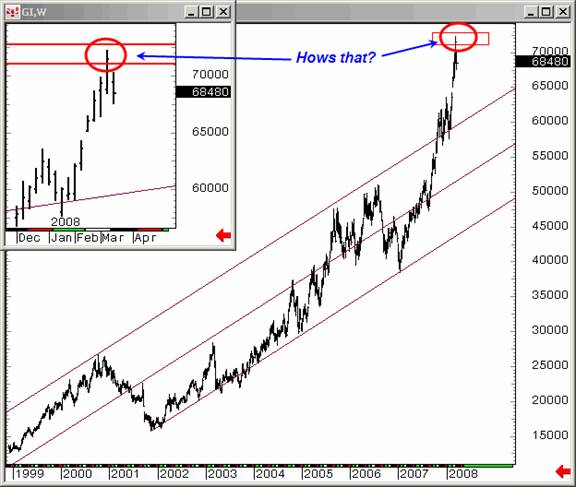
This week has also marked the beginning of an important reversal in the euro and commodities that we've been expecting for a while. The chart above shows perfection of my target for the Goldman Sachs commodity index. Look at the reversal pattern that cam out of it! Joe, our precious metals analyst, markedly pulled in his horns over the past week, saying on Thursday that we could be “hours or days” from a top in gold.
The bottom line is that many traders out there have become disenchanted with Elliott wave, but that's only because so many out there are doing it wrong! They don't have formulas to create the kinds of market maps we trade at TTC and they don't have our proprietary indicators or the collective market savvy either. How many have been looking backwards at the decline from February calling for a wave 3 down that never materializes while TTC has been saying there's a huge upmove to be had in here and that the all time top may not even be in yet?! Looking forward, we're satisfied with getting out at our 1333 target, some 77 points off the bottom, even if some more short-covering could keep the market up here for a while or even take us higher. Our members had the privilege of knowing 1256 and 1333 in advance, and they will have the targets to get long the next rally. While so many others try to trade the news and get burned, we'll stick with trading the charts!!
f you're thinking twice about paying for a reliable service, consider what we did this week which shows the bargain TTC members find week in and week out.
So, do you want to learn how to trade short term time frames? Would you like access to next week's charts posted in the weekly forum right now? Ten to twenty big picture charts are posted every weekend. If you feel the resources at TTC could help make you a better trader, don't forget that TTC will be closing its doors to new retail members this year. Institutional traders have become a major part of our membership and we're looking forward to making them our focus.
TTC is not like other forums, and if you're a retail trader/investor looking to improve your trading, you've never seen anything like our proprietary targets, indicators, real-time chat, and open educational discussions. But the only way to get in is to join before the lockout starts – once the doors close to retail members, we'll use a waiting list to accept new members from time to time, perhaps as often as quarterly, but only as often as we're able to accommodate them. Don't get locked out later, join now.
Have a profitable and safe week trading, and remember:
"Unbiased Elliott Wave works!"
By Dominick , a.k.a. Spwaver
www.tradingthecharts.com
This update is provided as general information and is not an investment recommendation. TTC accepts no liability whatsoever for any losses resulting from action taken based on the contents of its charts, commentaries, or price data. Securities and commodities markets involve inherent risk and not all positions are suitable for each individual. Check with your licensed financial advisor or broker prior to taking any action.
Dominick Archive |
© 2005-2022 http://www.MarketOracle.co.uk - The Market Oracle is a FREE Daily Financial Markets Analysis & Forecasting online publication.


