


Lookout For A Stock Market Spike High Top
Stock-Markets / Stock Markets 2013 May 21, 2013 - 04:54 PM GMTBy: Submissions

 HighRev writes: When attempting to put shorter term price action into a longer term perspective, I couldn't help but notice the tendency over recent years for markets to put in spike high tops on the intermediate term time frame. I also couldn't help but remember what Alexander Elder said when briefly recounting the origins and historical background of TA in his book Trading For A Living; specifically, on page 70, when commenting on changes in overall market behavior occurring on the generational time frame he said:
"Markets have changed a great deal since the days of Edwards and Magee. In the 1940's, daily volume of an active stock on the New York Stock Exchange was only several hundred shares, while in the 1990's it often exceeds a million. The balance of power has shifted in favor of the bulls. Early chartist wrote that stock tops were sharp and fast, while bottoms took a long time to develop. That was true in their deflationary era, but the opposite has been true since the 1950's. Now bottoms tend to form quickly while tops tend to take longer."
If we accept his thesis that predominant topping and bottoming price patterns invert in inflationary and deflationary environments, we would have to say that there is important technical evidence in the form of spike high tops seen over the last several years in various key markets that suggests that these markets believe that we are no longer in an inflationary environment on the intermediate term time frame. Indeed, these spike highs would be important technical confirmation of a great deal of macroeconomic data and, ultimately, the central bankers' need to effect an urgent and massive over-sizing of the global money stock; in short, they would be technical confirmation that we are in a deflationary environment.
The pattern of major spike high tops over the last decade and a half is easily recognizable in the following chart showing the daily closing basis price action of principal key markets representing small cap equities, bonds, oil, gold, finance and technology. Note how all have topped in spike high fashion on the intermediate term time frame - all except for equities that is (as of this writing anyway).
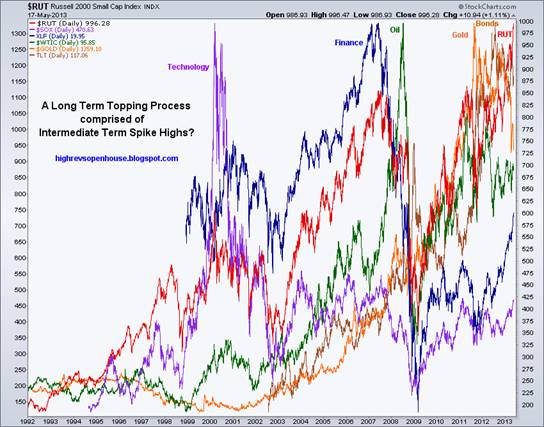
Additionally, technical analysis could also legitimately argue that this same chart also exhibits what might be a long term topping 'process' - made up of the combined individual spike highs - that perhaps is about to culminate with a last spike high in a series (which would be that holdout exception mentioned above, that is to say, the stock market). Again, when moving beyond the intermediate term and focusing on the long term, price action is giving us clear indications of a possible long term rollover made up of individual markets each putting in intermediate term spike highs.
The implications of this pattern recognition are significant, not just for the intermediate term, but for both the long term and short term as well. A series of intermediate term spike highs may be about to end with a final spike high in equities, which, in turn, would also mark the climax of a long term 'topping process' that is unsurprisingly part of a longer term (and perhaps culminating as well) inflationary era.
The setup is there, on the charts, now!
-------------------------------------o-------------------------------------
With this having been said, it should also be duly noted that the long term pattern could also be more horizontal in nature (the SPX, with its 2002-2003 and 2008-2009 spike lows to counterbalance its 2000 and 2007 spike highs, is a good example), meaning that, instead of a LT top, we'd have a LT trading range more completely defined. And, of course, there's always the possibility that equities could continue higher leading the rest of the markets mentioned in this article higher with them. Anything is possible, but possible is not the same as probable. My job is not to suggest one outcome or the other, rather it is to only outline the pattern recognition data, possible explanatory theories, and principal possible outcomes. The rest - assigning probabilities, risk management, trading and investment decisions, and the like - is up to you.
-------------------------------------o-------------------------------------
As a small business owner who also dabs in the stock market in the capacity of a small, independent, part-time retail trader, HighRev is the pseudonym I chose to use when I began participating in the financial blogsphere 2009. It's an abbreviation for High Revolutions, as in automobiles: I wanted to constantly remind myself of the "high rev" emotionality of financial markets in an effort to avoid all the "redline" pitfalls that await us in this business. Currently, my principal aim is to continue reminding myself of the same, and hopefully, as a byproduct, extend the same to others like me.
You can normally find me on my blog: HighRevsOpenHouse.blogspot.com
© 2013 Copyright HighRev - All Rights Reserved
Disclaimer: The above is a matter of opinion provided for general information purposes only and is not intended as investment advice. Information and analysis above are derived from sources and utilising methods believed to be reliable, but we cannot accept responsibility for any losses you may incur as a result of this analysis. Individuals should consult with their personal financial advisors.
© 2005-2022 http://www.MarketOracle.co.uk - The Market Oracle is a FREE Daily Financial Markets Analysis & Forecasting online publication.