


Gold, US Dollar Index and 3 Currency Market Forecasts
Currencies / Forex Trading May 20, 2013 - 10:41 AM GMTBy: David_Petch

 This article was posted for the benefit of subscribers on Wednesday, May 15th, 2013. I have included one Elliott Wave count of gold at the very end...it is not important to understand the wave count, just the implied direction, which should be hinted at the US Dollar Index. I was following a pattern for 5 years that changed due to one small thing that happened and was discussed for a few months now. Since it happened, it was a game changer and has important consequences for everything going forward. The Contracting Fibonacci Spiral that I discovered nearly two years ago is approaching its extended time post of May 21st, 2013 and if it extends further, the potential downside will be faster and see a compression in time for what the potential downside is. I would encourage everyone to at least read this article and try to understand the big picture, because it is one of the most important articles I have written in the past two years.
With the US Dollar Index taking out the critical level of 83.66 mentioned a few weeks ago, it invalidated the previous Elliott Wave count I had for the pattern since 2008 and required some restructuring. A significant amount of time was put into retooling the longer-term count, which will appear somewhat different, but it has very important implications going forward...the anticipated sharp rise in the US Dollar Index is going to happen right now, rather than later.
Currencies
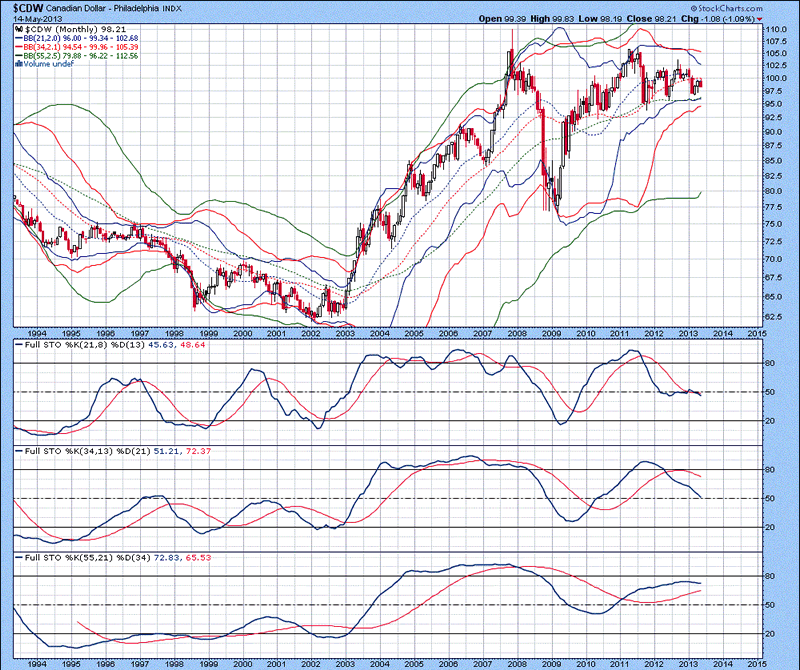
The monthly chart of the Canadian Dollar Index is shown below, with the lower 55 MA Bollinger band curling up, suggestive that a top was put in place. Full stochastics 1, 2 and 3 are shown below in order of descent, with the %K beneath the %D in 1 and 2 and above the %D in 3. Based upon this chart and the confirmed up turn in the US Dollar, there appears to be at least another 12-18 months of weakness in the Canadian Dollar before any sort of a bottom is put in place. There is strong support at 95, 90, 85 and then 80...support very much follows a ladder approach and when one support level is broken, probabilities increase that the next lower level will be tested f. Canada is a resource country with a heavy portion of GDP from mining, forestry, oil, natural gas and Uranium. For the most part aside from base metals and precious metals, commodity prices are relatively firm. The Canadian Dollar is likely to slip to at least 90 over the coming 4-6 months....further downside really depends upon how much upward momentum lies in the US Dollar.
Figure 1
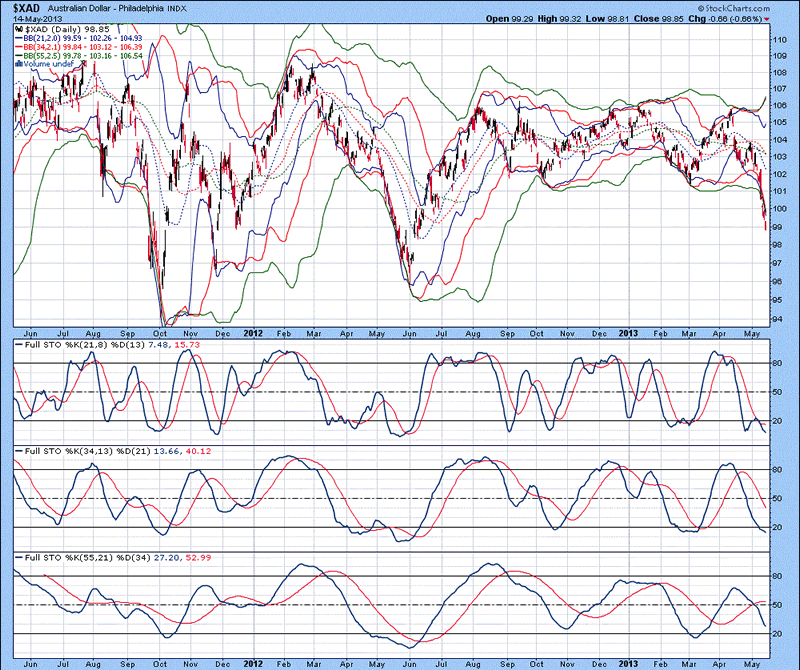
The daily chart of the Australian Dollar Index is shown below, with upper 34 and 55 MA Bollinger bands still rising, suggestive that further downward price action is likely for at least another 4-6 weeks. Full stochastics 1, 2 and 3 are shown below in order of descent, with the %K beneath the %D in all three instances. Extrapolation of the %K in stochastics 2 and 3 suggest downside is likely over the course of the next 4-6 weeks. There was a price excursion beyond all three lower Bollinger bands, so there could be some reprieve for 2-3 weeks before prices again drop or this is part of a powerful downward trend. The next level of support of the Aussie Dollar is at 96...3 cents away.
Figure 2
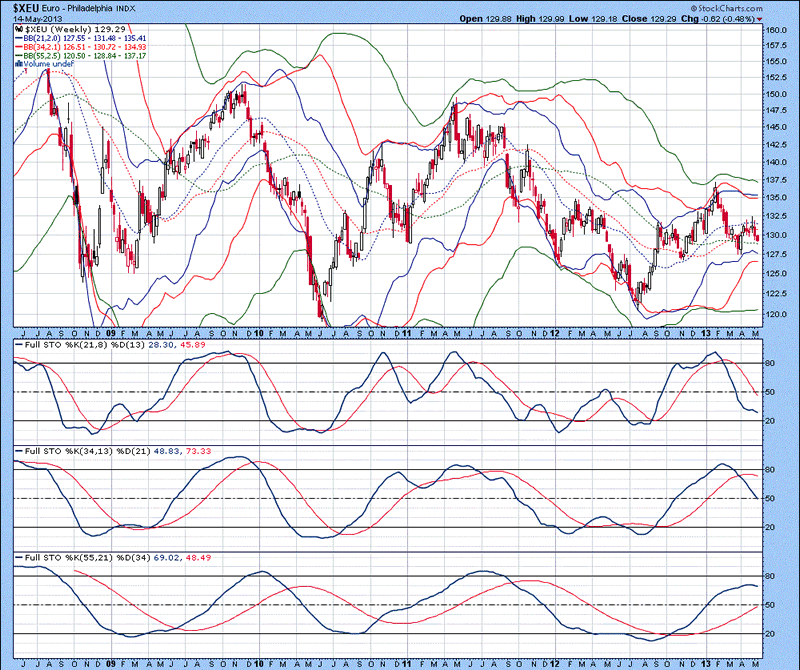
The weekly chart of the Euro Index is shown below, with lower 21 and 34 MA Bollinger bands curling down with stochastics 1 and 2 in a downtrend, suggestive that further downward price action is likely. A head and shoulders pattern seems to be in place, with a measured move down to 122.5. Full stochastics 1, 2 and 3 are shown below in order of descent, with the %K beneath the %D in 1 and 2 and above the %D in 3. Extrapolation of the %K in stochastic 1 and 2 suggest at least another 4-6 months of sideways to downward price action before any sort of a bottom is put in place.
Figure 3
US Dollar Index
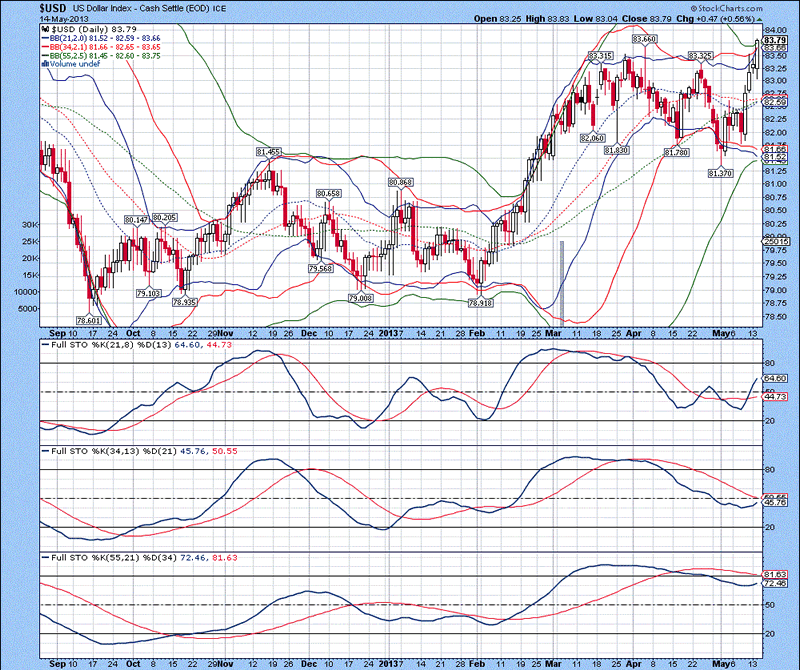
The daily chart of the US Dollar Index is shown below, with a clear breakout above 83.66, with an immediate upside price objective of 87. There was a price excursion above all three upper Bollinger bands, so expect a pause for at least 3-5 days starting no later than Friday to consolidate the sharp rise up the past 5 days. Full stochastics 1, 2 and 3 are shown below in order of descent, with the %K above the %D in 1 and beneath the %D in 2 and 3. With the %K in stochastics 2 and 3 hooking up, the upward trend of the US Dollar is expected to continue for at least another 3-5 weeks.
Figure 4
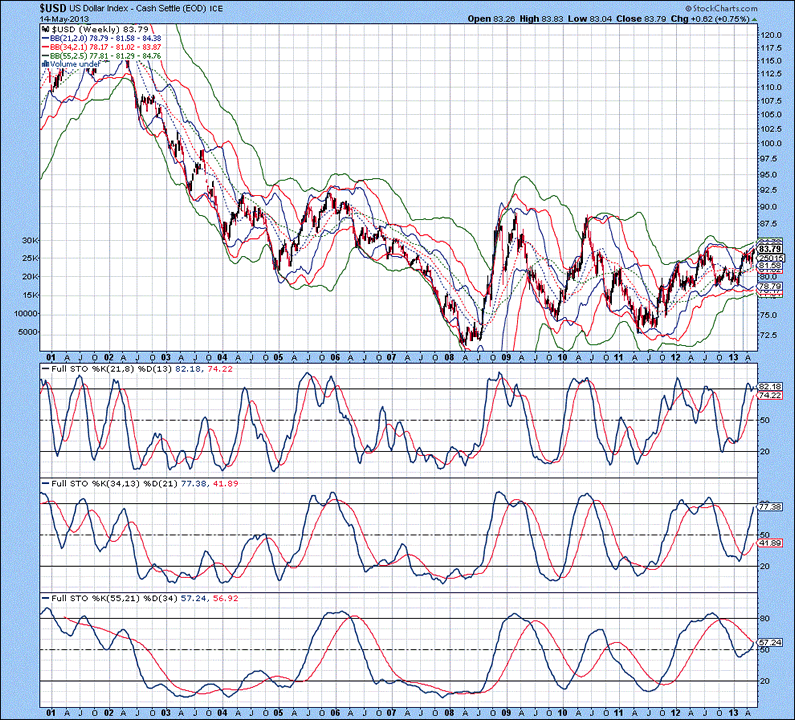
The weekly chart of the US Dollar Index is shown below, with upper Bollinger bands in close proximity to the current price, suggestive that further upward price action is likely. Full stochastics 1, 2 and 3 are shown below in order of descent, with the %K above the %D in 1 and 2 and just beneath the %D in 3. Extrapolation of the %K in stochastic 3 suggests at least 6-8 months of continued strength in the US Dollar Index before any sort of a top is put in place. The 87.0 level remains the immediate target with 90 following suit.
Figure 5
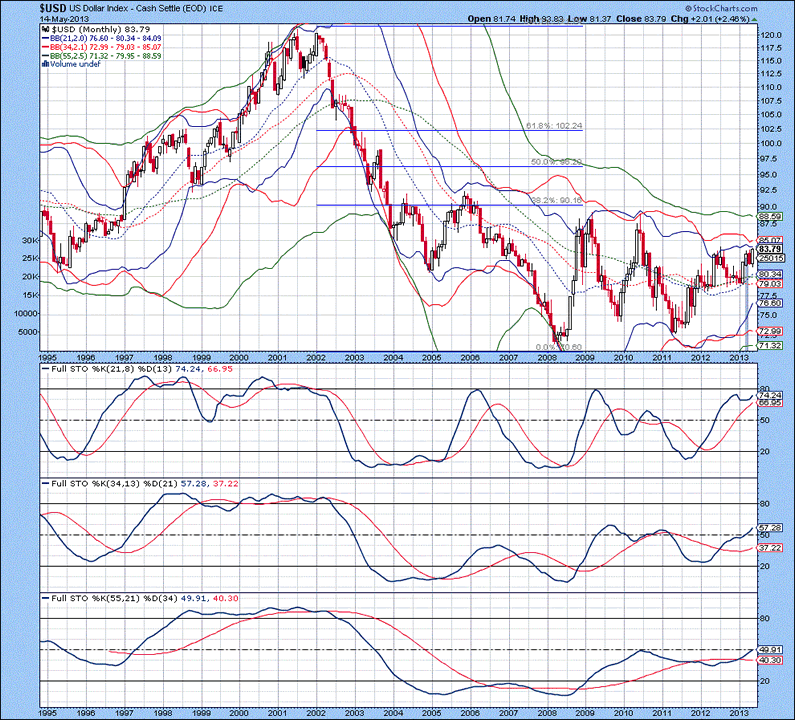
The monthly chart of the US Dollar Index is shown below, with upper 21 and 34 MA Bollinger bands in close proximity to the current price, suggestive that further upward price action is looming. Full stochastics 1, 2 and 3 are shown below in order of descent, with the %K above the %D in all three instances. The %K in stochastic 1 hooking up indicates at least 5-7 months of continued upside before any sort of a top is put in place.
Figure 6
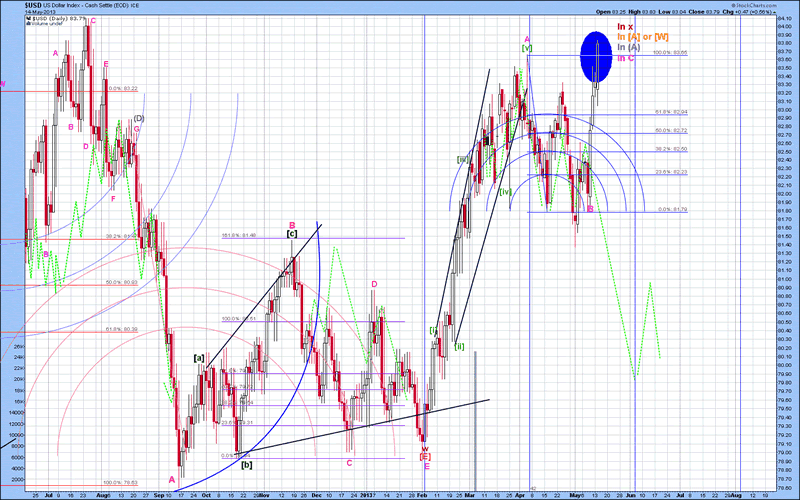
The short-term Elliott Wave count of the US Dollar Index is shown below, with wave C of a zigzag thought to be forming at present. This change in count was triggered by 83.66 being taken out. The pattern was either the start of a new downward trend (denoted by the green dashed line) or an upward trend. Until the upper or lower levels were taken out (83.66 and 81.5, respectively), both possibilities had equal chances of occurring. With the breakout happening yesterday, the US Dollar Index is on its way to at least 87 and potentially 90, depending upon how much upward strength remains.
Figure 7
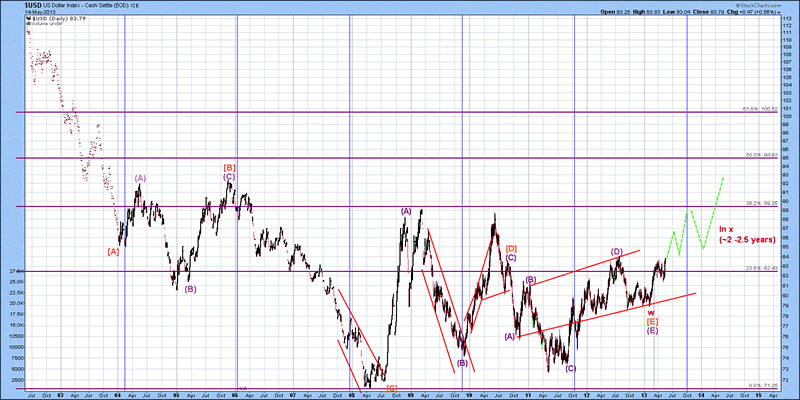
The mid-term Elliott Wave count of the US Dollar Index is shown below, with entire move down from 2002 until present as a contracting triangle with reverse alternation. Wave [E] which finished earlier this year had its own form of a lower Degree contracting triangle with reverse alternation. So, what does this change in pattern mean? Wave w as I have labelled it implies that wave x currently underway will last for anywhere from 2-2.5 years, which suggests weakness in precious metals for at least the same period of time. The minimum expected upward move during this x wave is to 89.35; Often time, x waves retrace 61.8% of their prior move, so it is within the realm of probabilities that 100.52 is reached near the end of this rally, which appears set to complete sometime around mid to late 2015. With the break of 83.66 yesterday, any hope of seeing the US Dollar decline has now officially been extinguished. Chances of this pattern presented being correct has at least a 95% level of confidence in being correct. There should be a pause in the US Dollar between the next 2-8 trading days and retrace anywhere from 23.6-38.2% of the advance before moving higher. As a word of caution, gold bear and US dollar bull funds are not functioning the way they should based upon projected trends, so the trades appear to be set in favour of the house.
Figure 8
Gold
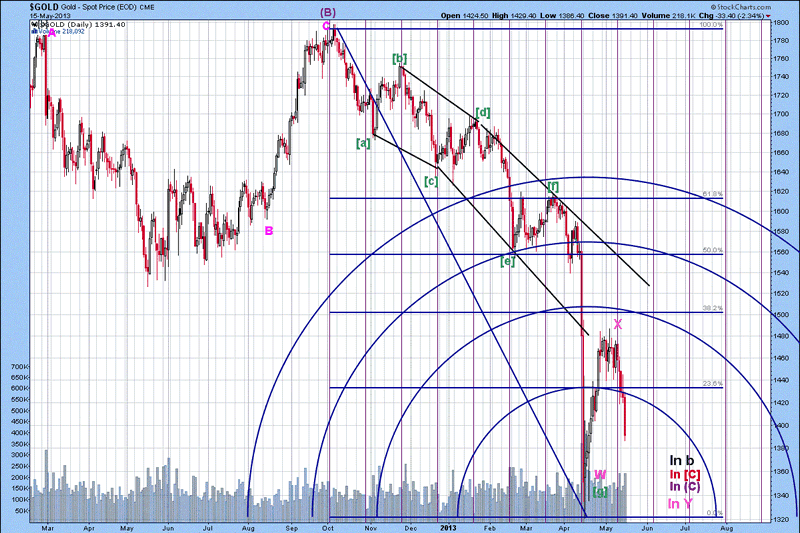
The short-term Elliott Wave count of gold is shown below and is the count we have been working with for the past 6 weeks. The decline from October until the mid-April bottom had each wave equivalent in time and complexity, but not price, classifying it as a diametric triangle. With this pattern, the subsequent X wave that was labelled minimally should have taken at least an equivalent amount of time as the shortest leg of the prior pattern. This one month time span was indicated as the time to sell into strength before the next down leg occurred. Based upon strength in the US Dollar Index, gold is likely to bottom between $1000-1100/ounce, followed by a rally of $350-550/ounce and again another down leg. Time frames will be identified in the coming weeks but note...this will be over a 12-24 month time frame at a minimum. Bottom line: Failure for gold to respond to the Cyprus events and Japanese currency expansion indicates how powerful the coming leg of deflation will likely be, which ties into the current CFS time post. For the latest information of the Contracting Fibonacci Spiral, refer to the April 2013 issue of Technical Analysis of Stocks and Commodities Magazine.
Figure 9
I am working on another CFS update that ties in with this analysis and what to expect in the coming few years. Have a great day.
By David Petch
http://www.treasurechests.info
I generally try to write at least one editorial per week, although typically not as long as this one. At www.treasurechests.info , once per week (with updates if required), I track the Amex Gold BUGS Index, AMEX Oil Index, US Dollar Index, 10 Year US Treasury Index and the S&P 500 Index using various forms of technical analysis, including Elliott Wave. Captain Hook the site proprietor writes 2-3 articles per week on the “big picture” by tying in recent market action with numerous index ratios, money supply, COT positions etc. We also cover some 60 plus stocks in the precious metals, energy and base metals categories (with a focus on stocks around our provinces).
With the above being just one example of how we go about identifying value for investors, if this is the kind of analysis you are looking for we invite you to visit our site and discover more about how our service can further aid in achieving your financial goals. In this regard, whether it's top down macro-analysis designed to assist in opinion shaping and investment policy, or analysis on specific opportunities in the precious metals and energy sectors believed to possess exceptional value, like mindedly at Treasure Chests we in turn strive to provide the best value possible. So again, pay us a visit and discover why a small investment on your part could pay you handsome rewards in the not too distant future.
And of course if you have any questions, comments, or criticisms regarding the above, please feel free to drop us a line . We very much enjoy hearing from you on these items.
Disclaimer: The above is a matter of opinion and is not intended as investment advice. Information and analysis above are derived from sources and utilizing methods believed reliable, but we cannot accept responsibility for any trading losses you may incur as a result of this analysis. Comments within the text should not be construed as specific recommendations to buy or sell securities. Individuals should consult with their broker and personal financial advisors before engaging in any trading activities as we are not registered brokers or advisors. Certain statements included herein may constitute "forward-looking statements" with the meaning of certain securities legislative measures. Such forward-looking statements involve known and unknown risks, uncertainties and other factors that may cause the actual results, performance or achievements of the above mentioned companies, and / or industry results, to be materially different from any future results, performance or achievements expressed or implied by such forward-looking statements. Do your own due diligence.
Copyright © 2013 treasurechests.info Inc. All rights reserved.
Unless otherwise indicated, all materials on these pages are copyrighted by treasurechests.info Inc. No part of these pages, either text or image may be used for any purpose other than personal use. Therefore, reproduction, modification, storage in a retrieval system or retransmission, in any form or by any means, electronic, mechanical or otherwise, for reasons other than personal use, is strictly prohibited without prior written permission.
David Petch Archive |
© 2005-2022 http://www.MarketOracle.co.uk - The Market Oracle is a FREE Daily Financial Markets Analysis & Forecasting online publication.