Will Soaring Stock Market Indices Hit the Ceiling?
Commodities / Gold and Silver 2013 May 17, 2013 - 04:13 PM GMTBy: DailyGainsLetter
 Moe Zulfiqar writes: The stock market rally that began in March of 2009 is gaining attention once again. The key stock indices have surpassed the highs they registered before the U.S. economy was hit with a financial crisis and the ones made at the peak of the tech boom.
With all this, the direction in which the key stock indices are headed next has become a topic of discussion among investors: can they go any higher? Or we are bound to see another market sell-off, like the one we saw in 2008 and early 2009?
When looking at the state of the global economy, things are turning bleak. We have major economies outright worried about their future economic growth. For example, the Chinese economy is expected to grow at a slower rate compared to its historical average; the Japanese economy is still struggling with a recession, and efforts by the Bank of Japan to boost the economy haven’t really showed much success; and the eurozone is witnessing its longest economic contraction, with major nations falling prey to economic slowdown.
But looking at the U.S. economy, it portrays a different image; it appears things have improved. Unemployment is lower and consumer spending has increased since it edged lower in the financial crisis—both possible good signs of a stock market rally.
To no surprise, the noise is getting louder and louder as the key stock indices are moving higher. The bears are calling for the end of the bull market, while the bulls are cheering for the key stock indices and believe that they are bound to go much higher. Estimates are being thrown out; for example, some are calling for the Dow Jones Industrial Average to reach 20,000.
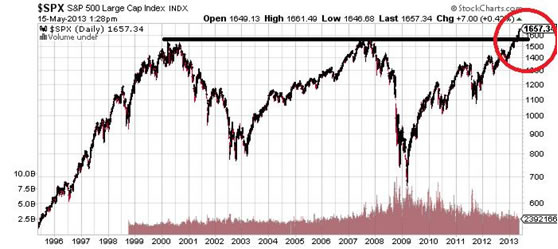
Regardless of the noise, looking at the long-term chart of the key stock indices like the S&P 500 and the Dow Jones Industrial Average, it appears they are in a breakout. Take a look at the long-term chart of the S&P 500 below:

Chart courtesy of www.StockCharts.com
The S&P 500 recently broke above the previous resistance area (as indicated by the red circle in the chart above)—an area that’s considered an important level by technical analysts and where the index turned and headed lower in 2000, and then again in 2007. However, the chart shows the direction is currently in favor of the bulls—the key stock indices may just continue to climb higher.
By looking at this, should investors jump into the stock market with full force and buy? The answer to this question is simply “no.”
From the chart above, it is clear that the key stock indices like the S&P 500 are in long-term breakouts, but there are still some risks that investors need to watch out for. Things can turn very quickly, and they might just hurt their portfolio with losses.
To profit from the soaring key stock indices, investors may want to look at exchange-traded funds (ETFs) that track the performance of the stock market. One example of this type of ETF is the SPDR S&P 500 (NYSEArca/SPY), which tracks the performance of the S&P 500. Another ETF worth looking at is the SPDR Dow Jones Industrial Average (NYSEArca/DIA); as the name suggests, this ETF lets investors track the performance of the Dow Jones Industrial Average.
Regardless, investors need to continue to focus on asset allocation, because a portfolio allocated to just one asset class can be too risky. Those who are saving for retirement should continue to focus on this principle, since every penny counts.
Copyright © 2013 Daily Gains Letter – All Rights Reserved
Bio: The Daily Gains Letter provides independent and unbiased research. Our goal at the Daily Gains Letter is to provide our readership with personal wealth guidance, money management and investment strategies to help our readers make more money from their investments.
Daily Gains Letter Archive |
© 2005-2022 http://www.MarketOracle.co.uk - The Market Oracle is a FREE Daily Financial Markets Analysis & Forecasting online publication.


