U.S. Economy Staring Into The Abyss! Only Gold is Worth Buying
Stock-Markets / Financial Markets 2013 May 12, 2013 - 07:38 PM GMT "Behind every great fortune there is a crime." - Honore de Balzac (1799-1850)
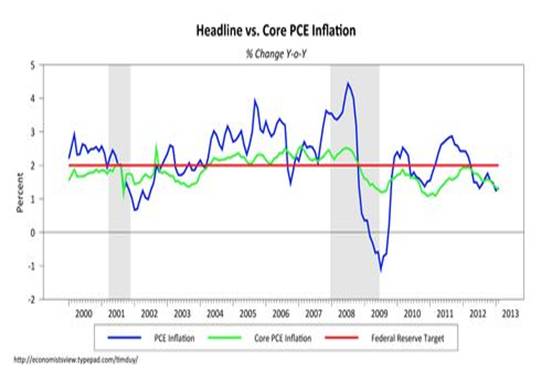
A number of important figures are now talking about the possibility of increasing the US Federal Reserve’s quantitative easing given the “decline in inflation.” In March we heard comments from Fed Presidents Eric Rosengren and Narayana Kocherlakota calling for QE well into 2014 while Chicago Fed President Richard Evens thought the Fed needed to do more. Then in April the St. Louis Fed President James Bullard came out on a number of occasions saying inflationary pressures may be growing too weakly and if they soften further, the central bank may have to boost its asset buying to bring price pressures back up to more desirable levels. They all share one thing in common, they are worried about a decline in the rate of inflation as seen in this chart:
With the Fed's preferred inflation target trending down, these gentlemen think it seems a little silly to start talking about ending the asset purchase program when in fact you might need to increase it.
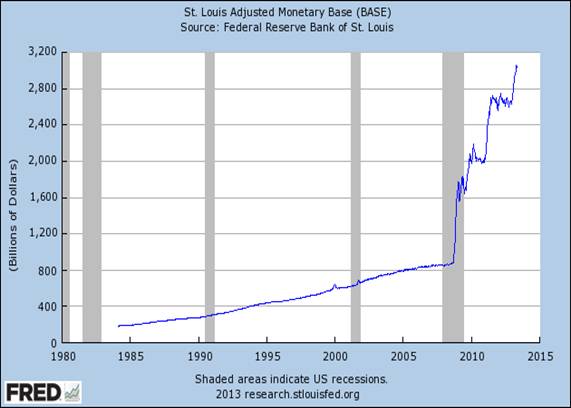
What’s all the noise about? Quite simply the Fed missed the boat and the much-heralded expert on the causes of the Great Depression, Ben Bernanke, will be responsible for the deflationary spiral that is now gripping the nation. That’s right! The man famous for saying that he has helicopters and a printing press, and knows how to use them, has let the wolf in the door. The fact that everybody is still on inflation watch even though inflation left the building a long time ago, is an effort to ‘sing the bull to sleep.’ The media constantly drags out experts to tell us that current central bank policy will lead to higher inflation, or even hyperinflation. We had inflation, but we don’t have it anymore! Now we have deflation and everybody is in denial. Typically the experts will point to the expansion of the monetary base and, relying on past performance, assume that high inflation is a logical consequence:
Without a doubt there was a brutal expansion in the monetary base beginning in 2008, but that’s less than the whole story. The problem I see is that the money never made it out of the banks that received it. You can see that
in the following chart showing the growth in the monetary bases of the EU, UK and US. They’ve all expanded to various degrees, but there is little or no growth in bank credit:
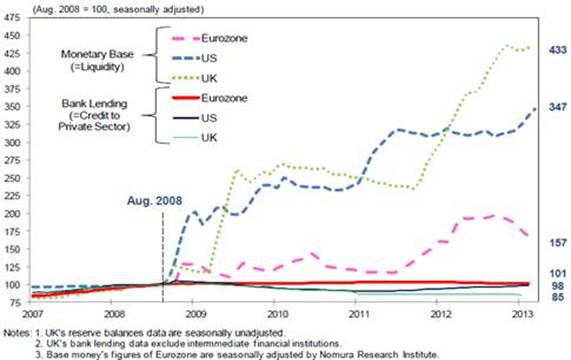
Most people understand that the economy will never grow if people don’t have access to credit, and this is especially true for small and medium sized businesses. The small and medium sized businesses are the mainstay of the US economy producing most of the growth and jobs we need to advance.
What happens to all of this money? The domestic banks deposit these funds back into their respective central banks to earn risk free interest. What do the central banks do with the money? They finance their respective government’s debt. Think of this as owning your own candy store and you are constantly eating your profits! The fact that the politicians have access to a printing press has convinced then that they can spend whatever they want with no consideration as to whether or not the debt will ever be productive. That’s how you end up with a chart that looks like this:
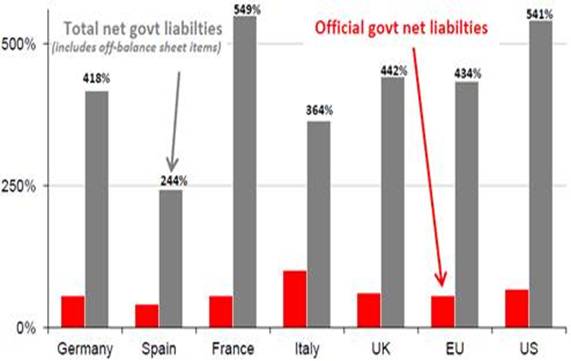
Source: Societe Generale Cross Asset Research
If you look at total government liabilities as a percentage of GDP, you’ll see that the western world is completely out of control. Surprisingly the biggest offenders are not the ones you hear about in the media (Spain and Italy); instead it’s the US and France with Germany not all that far behind.
That brings us to the real problem. Debt is everywhere, more than US $1.3 quadrillion in a world worth approximately US $80 trillion. To make matters worse debt has taken on a life of its own and we’re now to the point that no amount of printing can allow the Fed to catch up to the growing debt. That’s the problem in a nutshell, debt can now outrun the printing press and that’s why you’ll see deflationary pressures grow. Take a look at this chart of the CRB Index and you’ll understand:
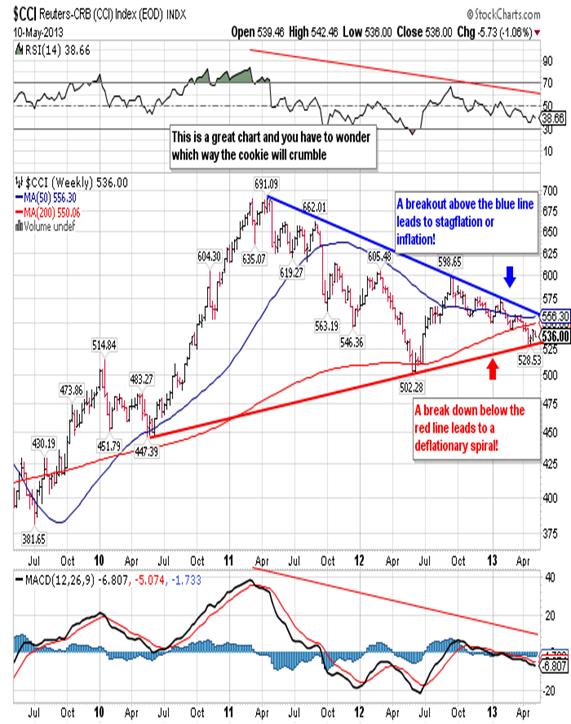
Prices have been on the decline since early 2011 and in spite of QE2, Operation Twist and QE3. If I had told you two years ago this would happen, you would have questioned my sanity. With respect to commodities we’ve seen significant breakdowns in the prices of oil, copper, sugar, coffee and lumber to name a few. If you look closely at the chart you see that the Index is coming to a crossroads as the downward sloping top band is closing in on the upward sloping bottom band, and we’re about out of space. Since these bands go back years the ensuing breakout will be a major event, up for inflation/stagflation or down for deflation. My bet is it will be lower.
Pressures are mounting everywhere as the Fed needs to print more and at the same time it must find a way to support the dollar for as long as it can. A stable dollar creates the illusion of confidence. Since the Fed can’t make the dollar look better it must make other currencies look worse, so it prodded Japan to issue US $1.3 trillion in quantitative easing. Then it convinced the EU to lower rates and ECB President Mario Draghi to consider more printing. All of that makes people forget the Fed’s past transgressions and seek at least temporary refuge in the greenback. As long as the dollar is stable, or moving marginally higher, the Fed can print more.
The end result is a dollar that has actually trended higher since early 2011 and we can get a close-up of the Fed’s handiwork in the following chart:
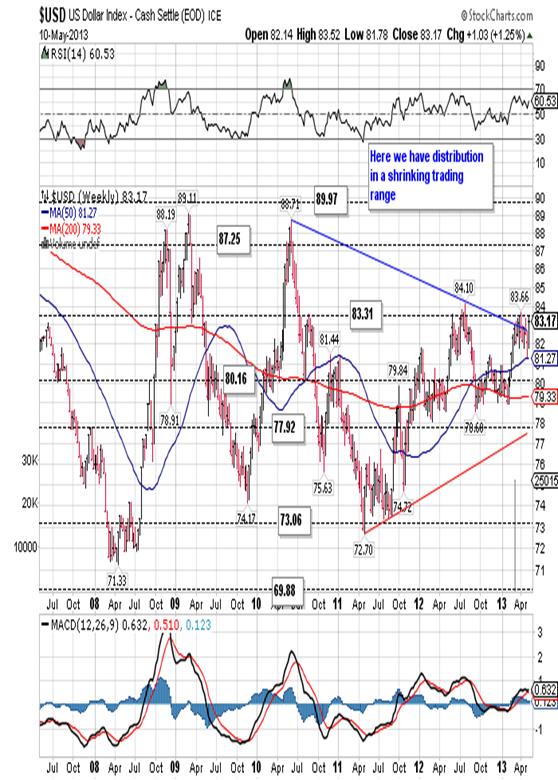
On Friday the spot US Dollar Index closed at 83.17 and so far it has failed to penetrate the good resistance at 83.31. That may be about to change though as the greenback has broken back above the trend line that connects the last two major highs to each other. The last significant high was at 84.10 and I would not be surprised to see that tested within a week or two. I could actually see the dollar moving as high as the 85.51 resistance (not shown) over the short run. Over the long run though it’s still a terrible bet.
Another problem child for the Fed is the bond market and inversely the interest rate. The Fed has been a proponent of
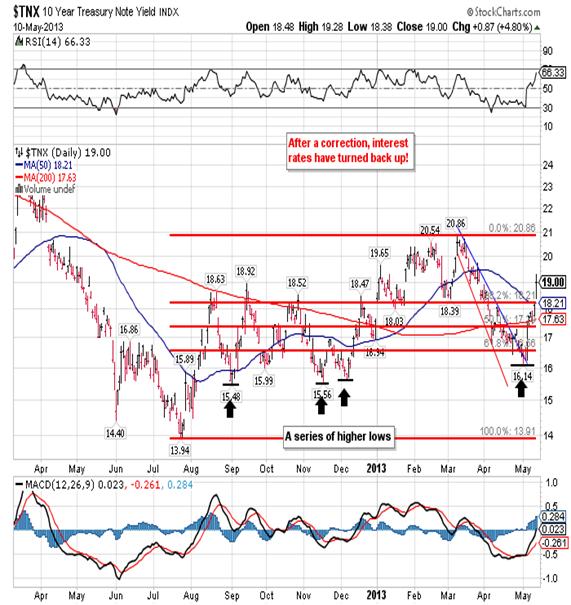
zero interest rates for several years, but as you can see in this chart of the yield on the 10-Year Treasury, things aren’t working out quite as planned. Interest rates have been rising since July of last year, and that along with a rising dollar makes dollar denominated debt a lot more expensive to service.
With bond prices falling after putting in a significant lower high on May 1st, the market has given up almost half of the
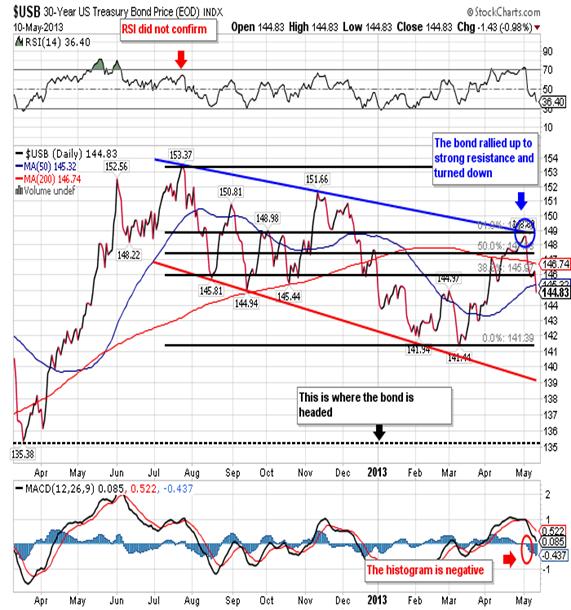
gains from the previous 37-day rally. The fact that is can give back almost half the gains from a 37-day rally in just seven sessions, is a sign of considerable weakness. Finally, you must look at what the US bond is competing against. If I’m one of the BRIC nations I would have to think twice about buying US debt from the world’s largest debtor when I could buy EU debt, back-stopped by the ECB (with a much smaller balance sheet) and 27 nations behind it. There’s really not much to think about there.
So I have zero interest rates and bonds headed lower. The US dollar is stable or going slightly higher but I don’t earn any interest if I sit in cash. The commodities in the crapper and the majority of investors shy away from shorting a declining market. Even gold, a winner for eleven years, has been going the wrong way, so where do I go? I’m a hedge fund manager sitting on cash with a need to put money to work. Otherwise I won’t be a hedge fund manager for very long. I look at the Dow and I see a market rallying on declining volume for a prolonged period of time, non-confirmations by RSI or the Transports every so often and the sector-leading stocks heading lower as earnings disappoint in an economy that appears to be slowing down.
Yet If I look closer I’ll see that the Fed uses the Dow as a measuring stick so they pump money into the banks (don’t forget that J P Morgan and Goldman are now banks) with an implied agreement that they buy stocks to push the Dow higher. That’s how I end up with a chart that looks like this:
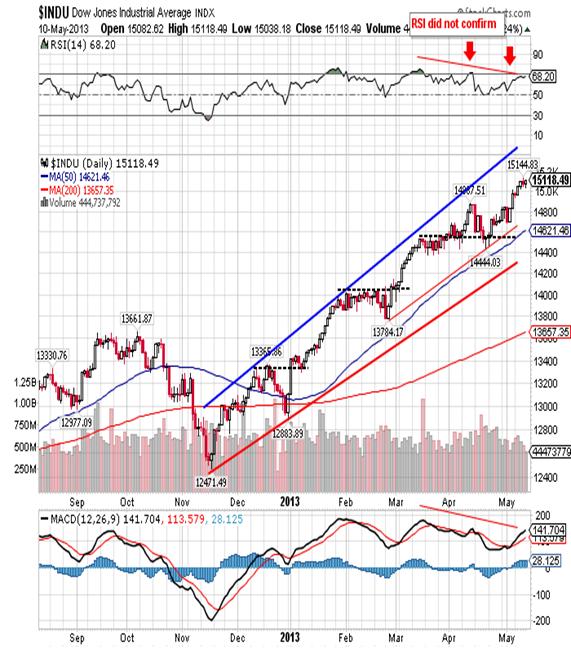
On Friday the Dow closed at 15,118, a new all-time closing high and the fifth such closing high in the last seven sessions! The Transports closed out Friday on a positive note, up 36 points at 6,375, but just short of a new closing high. I should mention that the Transports did make new all-time closing highs on Monday, Tuesday and Wednesday so the week wasn’t a total loss!
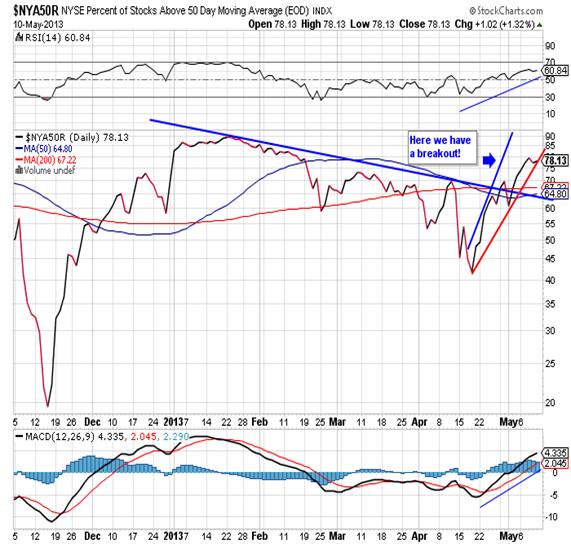
Aside from confirmation between the two major indexes there are other reasons to buy the Dow right now. If you look at the percentage of stocks trading above there 50-dma you’ll see that they’ve recovered nicely and have broken out to the upside:
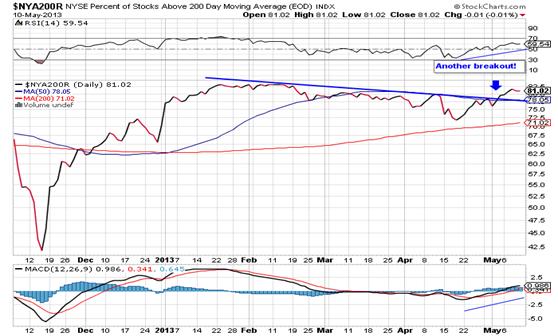
The same can be said for the percentage of stocks trading above their respective 200-dma:
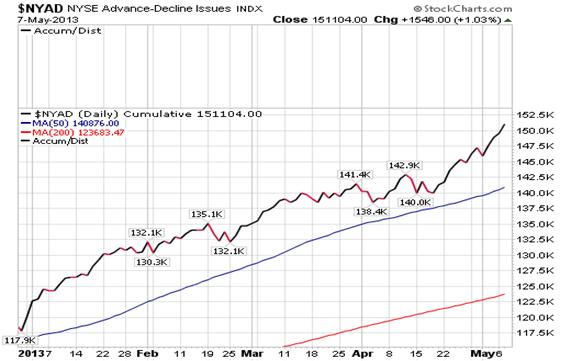
as well as the advance-decline line for the NYSE below, at a new high on Wednesday:
So I can find plenty of reasons to buy the Dow as long as I keep in mind that it’s a short-term investment and I’d better get the hell out before the music stops.
That leaves us with gold. The yellow metal is still in a sideways funk and I can make a case for a move either way. Here you can see the sideways movement leading up to the sharp sell-off and the subsequent recovery:
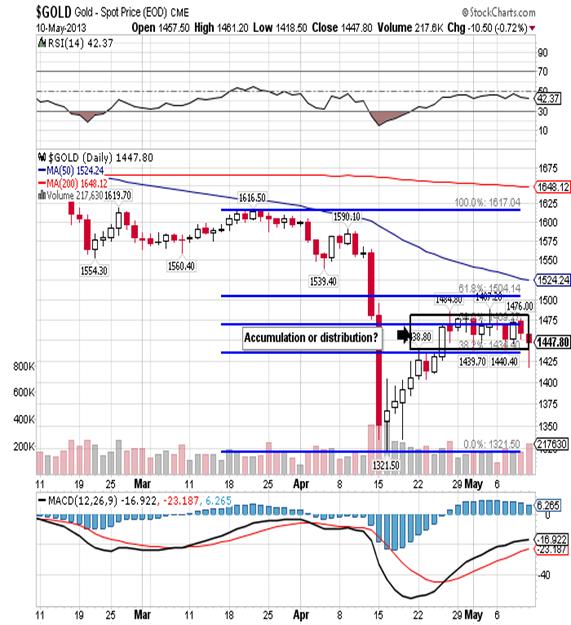
Gold moved nicely from the 1,321.50 bottom up to the resistance from a 50% retracement at 1,469.50. Once there it began to move sideway between the 1,469.50 resistance and the support at 1,434.40 from the 38.1% retracement, until Friday. On Friday we saw a sharp drop that began during the night at 1,461.00 and fell down to a morning low of 1,418.40. It then recovered to close out the week at 1,447.80.
In all honesty it bothers me that gold has made numerous attempts to move beyond the 1,469.50 resistance, and they’ve all been rejected. It bothers me even more that Friday’s decline not only fell below the 1,434.40 support but also spent time below the 1,423.90 support (not shown). That tells me that we’re probably not quite done to
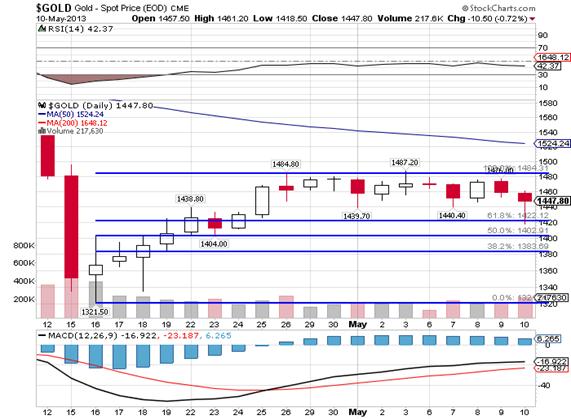
the downside just yet so I’m looking for a test of strong support at 1,402.90 on Monday or Tuesday. In my opinion that test will tell us a lot.
Given everything that’s developed over the last couple of months, and in particular over the last four weeks, I see four possible outcomes:
- i.) Friday’s dip was a fluke and the bottom is in and we’ll move up from here through the critical 1,522.00 area and eventually a lot higher, or
- ii.) We’ll continue lower on Monday or Tuesday to test good support at 1,402.90, a 50% retracement of the gains from the 1,321.50 low to the recent 1,487.20 high. We’ll hold the support and eventually start to rally up and through the resistance at 1,469.50 and keep grinding higher throughout the year, or
- iii.) We’ll break below the 1,402.90 support and we’ll run down to retest the 1,321.50 April low. Gold will hold at or slightly above the April low and then begin a journey up to much higher levels.
- iv.) The last case scenario is where gold falls down to 1,321.50, breaks below it and falls all the way down to 1,100.00 in a volatile, fast break (no more than two or three weeks, followed by a sharp recovery and an eventual move to much higher highs.
Notice that all four scenarios end with a move to much higher (new all-time) highs, the only difference is the amount of pain we need to suffer in order to get to those new highs.
I believe we’ll more than likely see either the second or third scenario play out, and I would give either one the same chance of happening. Although the first scenario is possible, I don’t think so, and the fourth scenario is the least likely. In any event any decline from here will be quick and offers a decent shorting opportunity for those looking for a quick profit. For those of you who want to by gold for the long haul, it really doesn’t matter what happens over the next couple of weeks because gold is going higher over time. Finally, Richard Russell and Jim Sinclair think the bottom is in and the latter published on his website he was looking for an intermediate top on May 2nd to 3rd and a pullback bottom during May 9th to 12th so will see how that plays out. Both these gentlemen know what they’re talking about, but I still have a feeling that it won’t be quite that easy. I hope they’re right.
CONCLUSION
In conclusion I see a number of opportunities out there. For those of you who like stocks you can buy the Dow looking for a 1,000 to 2,000 point gain over the next couple of months. The Fed has your back and any declines are a good excuse to add on. As good as that may sound the best investment out there for 2013 is to short the bond market. Unfortunately most people have it in their head that shorting something is dangerous, but they’re wrong. If something goes up or down a dollar, it’s a dollar. It’s not a dollar plus if you’re short and the stock it goes up. It’s a dollar. The Fed now buys 70% of all bond emissions; the bond pays a negative real interest rate, and its denominated in a currency that has a terrible long-term outlook. That’s a tough sell and more and more buyers are looking elsewhere. Aside from that the supply will only increase over time as the spending machine in Washington careens completely out of control.
If you look beyond the end of this year and two or three years down the road then the only thing worth buying is gold. The printing war currently gripping Japan, the EU and the US can only end in tragedy, and anyone who thinks otherwise is fooling themselves. Gold, assuming you’ll be able to hang on to it, will be one of the few things that will protect you. The Fed continues to blow bubble after bubble and now we’re recycling bubbles (real estate and stocks), but the real bubble is debt. When the debt bubble bursts, as all bubbles eventually do, there won’t be a lot left.
Finally, you need to think about getting assets out of the US and Europe and into places like Singapore, Lichtenstein, Montevideo, St. Croix, Peru and Hong Kong. Once you have a base there you can work on a second passport. All this seems strange to you now but once the last of your civil liberties goes up the stack, you’ll understand why I’m telling you this. Of course it will be too late by then.Robert M. Williams
St. Andrews Investments, LLC
Nevada, USA
Copyright © 2013 Robert M. Williams - All Rights Reserved Disclaimer: The above is a matter of opinion provided for general information purposes only and is not intended as investment advice. Information and analysis above are derived from sources and utilising methods believed to be reliable, but we cannot accept responsibility for any losses you may incur as a result of this analysis. Individuals should consult with their personal financial advisors.
Robert M. Williams Archive |
© 2005-2022 http://www.MarketOracle.co.uk - The Market Oracle is a FREE Daily Financial Markets Analysis & Forecasting online publication.


