


US Stock Market Uptrend Continues
Stock-Markets / Stock Markets 2013 May 11, 2013 - 06:15 PM GMTBy: Tony_Caldaro

 It was another week of all time record highs on Wall Street. The SPX hit 1635, nearly 1,000 points off the March 2009 low. And, the DOW closed over 15,000 for the first time in its 117 year history. For the week the SPX/DOW were +1.10%, the NDX/NAZ were +1.45%, and the DJ World index was +1.0%. On the economic front it was a quiet week, but positive reports again outnumbered the negative one 5-1. On the uptick: wholesale inventories, the M1 multiplier, the WLEI, plus weekly jobless claims and the Treasury budget improved improved. On the downtick: consumer credit. Next week, options expiration week, the economic flood gates open again: highlighted by Industrial production, PPI/CPI, Retail sales and Housing. Best to your week.
LONG TERM: bull market
Back in mid-March 2009 when we made the call, around SPX 700, for a three wave rally to SPX 1150 by early 2010. I do not think there was 5% of our readers who agreed with us. Then, when we made the call in February 2010, that the advance wasn’t just a B wave rally but a Cycle wave [1] multi-year bull market. We probably had about 5% again. Since then there have been a couple of times when this bull market hit an inflection point: mid-2011 and again in 2012. But each time it recovered, thanks to the FED’s liquidity programs, and here we are at all time new highs.
We have observed in recent weeks, especially after new highs were hit. A growing shift in sentiment from neutral-bullish, to outright bullishness. “QE forever” was a recent quote in one of the blog comments. We sense the doom and gloom in 2009, when the market bottomed, will reach a euphoric boom by time the market tops. We are not there yet. When the top does arrive, however, we would again expect about 5% of our readers to agree. Project, monitor an adjust.
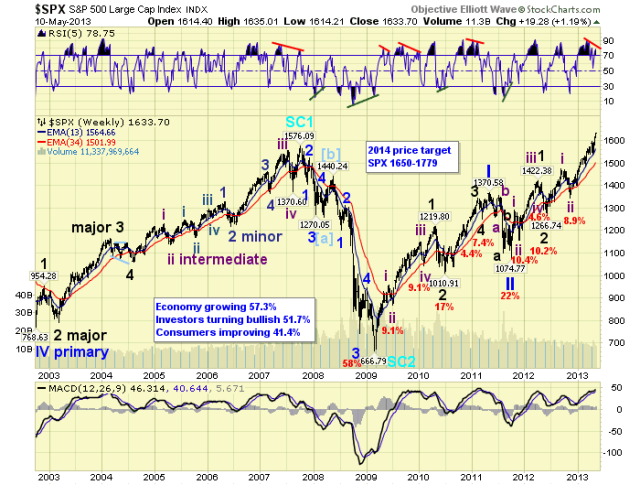
SPXweekly
Our long term bull market count remains unchanged. Super cycle wave 2 ended in March 2009, and Cycle wave [1] of the next Super cycle bull market is underway. Cycle wave bull markets unfold in five Primary waves. Primary waves I and II completed in 2011, and Primary wave III has been underway since then. Primary I divided into five Major waves with a subdividing Major wave 1. Primary III is also dividing into five Major waves, but both Major waves 1 and 3 are subdividing into five Intermediate waves. Major waves 1 and 2 completed by Mid-2012, and Major wave 3 has been underway since then. Intermediate waves i and ii completed by late-2012, and Intermediate iii has been underway since mid-November.
We still expect this market to follow this Int. iii uptrend with an Int. iv downtrend. Then an Int. v uptrend to complete Major wave 3, followed by a Major 4 downtrend. Then a Major 5 uptrend to complete Primary III, followed by a Primary IV downtrend. Finally a Primary V uptrend to complete the bull market by early 2014 between SPX 1650 and 1780.
MEDIUM TERM: Int. iii uptrend continues
During a six month uptrend there are periods of time when traders think the market will never correct again. We had one of those periods at the beginning of the year that lasted until mid-February. And apparently we are in one now.
We continue to count this uptrend as Intermediate wave iii. It has divided into five Minor waves: Minor 1 SPX 1424, Minor 2 SPX 1398, Minor 3 SPX 1597, Minor 4 SPX 1536 and Minor 5 still underway. In last weekend’s report we noted a few wave relationships, suggesting some resistance levels ahead. Please review that report for the details.
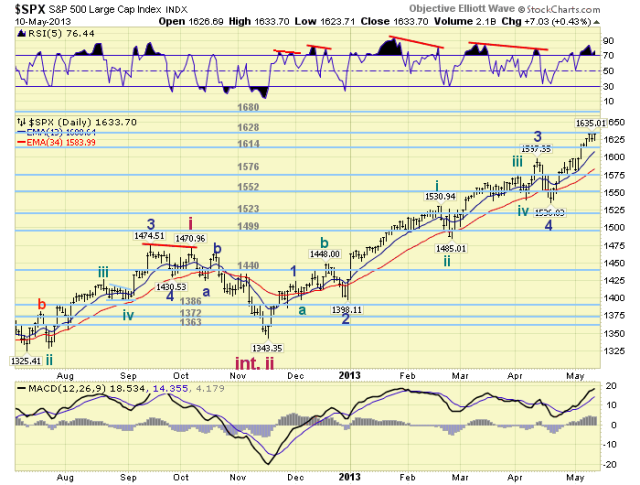
SPXdaily
During this bull market there have been two previous lengthy uptrends in time, and three lengthy ones in points gained. The two longest uptrends lasted six and seven months, and both were third waves. This uptrend has already risen for six months. The three largest point gains were 281, 289 and 333 points. Two of those advances were third waves. If we add these numbers to the SPX 1343 Int. ii low we arrive with: SPX 1624, 1632 and 1676. This uptrend hit SPX 1635 this week.
We also noted last weekend the rallies, during this uptrend, have all been related to each other in Fibonacci relationships. And, if Minor wave 5 advances beyond 89 points, (SPX 1625), which was the length of Minor 1 and Minute iii. It is likely to reach the length of Minute i, which was 133 points, or SPX 1667. With the OEW 1628 pivot range covering the lower numbers: 1624, 1625 and 1632, we placed a cutoff at SPX 1635. This is exactly where the market stopped on Thursday. When the uptrend clears this level, which is likely, the next two levels to watch are SPX 1667 and the OEW 1680 pivot range, which includes 1676. To conclude: when SPX 1635 is exceeded the next resistance is the SPX 1658-1667 zone, then the OEW 1680 pivot.
SHORT TERM
Short term support is at the 1628 and 1614 pivots, with resistance at the SPX 1657-1667 zone and the 1680 pivot. Short term momentum ended the week slightly overbought. The short term OEW charts have been positive since SPX 1581, with reversal level now 1617.
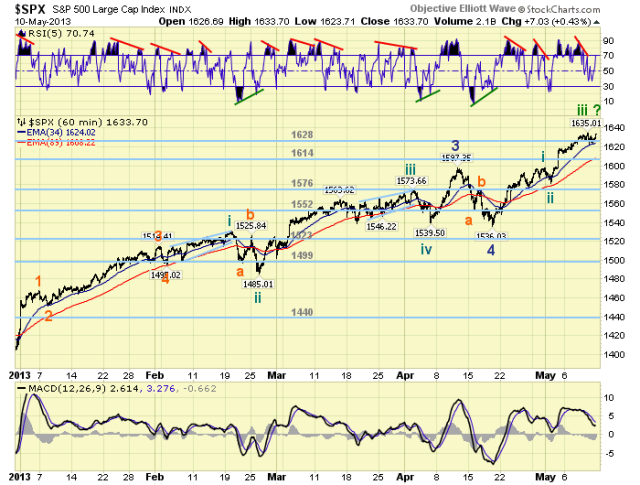
With the uptrend in Minor wave 5 we have been tracking its advance from the SPX 1536 low. We counted an impulse wave to SPX 1598, labeled that Minute i. Then a pullback to SPX 1581, which was labeled Minute ii. Minute iii has been underway since that low. After a strong 54 point rally, the advance had its first significant pullback on Thursday, (SPX 1635-1623). This could have signaled the end of Minute iii if this pullback continues lower into the SPX 161x’s. If not, and it makes new highs, it was probably only waves 1 and 2 of Minute iii. Early next week should give us the answer. Best to your trading!
FOREIGN MARKETS
The Asian markets were mostly higher on the week for a net gain of 2.5%. Only S. Korea remains in a downtrend.
The European markets were all higher on the week for a net gain of 2.0%. All indices are uptrending.
The Commodity equity group were mixed for a net gain of 0.2%. Only Canada remains in a downtrend.
The DJ World index is uptrending and gained 1.0%.
COMMODITIES
Bonds again had an okay week then a bad Friday, losing 0.7% on the week. Bonds yields have already confirmed an uptrend.
Crude has been quite volatile, as usual, and gained 0.5% on the week. Always difficult to track its bear market, but it looks like an uptrend is underway.
Gold remains in a bear market downtrend and lost 2.3% on the week.
The USD confirmed an uptrend gaining 1.3% on the week. The EUR looks to be heading lower losing 1.0% on the week, as the CHF has already confirmed a downtrend.
NEXT WEEK
Monday kicks off the week with Retail sales at 8:30, then Business inventories at 10:00. Tuesday: Export/Import prices. Wednesday: the PPI, NY FED, Industrial production and the NAHB housing index. Thursday: weekly Jobless claims, the CPI, Housing starts, Building permits, and the Philly FED. Friday: Options expiration, Consumer sentiment and Leading indicators. As for the FED. FED governor Raskin gives a speech on Thursday in Wash. DC. Then FED chairman Bernanke gives a speech on Saturday in Mass. Best to your weekend and week.
CHARTS: http://stockcharts.com/...
http://caldaroew.spaces.live.com
After about 40 years of investing in the markets one learns that the markets are constantly changing, not only in price, but in what drives the markets. In the 1960s, the Nifty Fifty were the leaders of the stock market. In the 1970s, stock selection using Technical Analysis was important, as the market stayed with a trading range for the entire decade. In the 1980s, the market finally broke out of it doldrums, as the DOW broke through 1100 in 1982, and launched the greatest bull market on record.
Sharing is an important aspect of a life. Over 100 people have joined our group, from all walks of life, covering twenty three countries across the globe. It's been the most fun I have ever had in the market. Sharing uncommon knowledge, with investors. In hope of aiding them in finding their financial independence.
Copyright © 2013 Tony Caldaro - All Rights Reserved Disclaimer: The above is a matter of opinion provided for general information purposes only and is not intended as investment advice. Information and analysis above are derived from sources and utilising methods believed to be reliable, but we cannot accept responsibility for any losses you may incur as a result of this analysis. Individuals should consult with their personal financial advisors.
Tony Caldaro Archive |
© 2005-2022 http://www.MarketOracle.co.uk - The Market Oracle is a FREE Daily Financial Markets Analysis & Forecasting online publication.