If You're Not Buying Stocks Yet, You Need to See These Charts
Stock-Markets / Stock Market Valuations May 11, 2013 - 11:43 AM GMTBy: DailyWealth
 Dr. David Eifrig writes: Last month, I ran through a set of figures that cover a huge concern for retirees.
It's vitally important information that affects nearly every dollar you have invested... yet most of what you hear about this idea is "bunk."
I'm talking about the concern that the U.S. economy is "running off the rails"... that we are in a recession... or worse, a depression.
The figures I presented showed that our economy was growing slowly, without inviting a sharp increase in inflation. Today, nothing much has changed... No surprises, just steady progress. It's the sort of environment that leads to gains in your stock portfolio.
But how much money should you have in stocks? And after their big rise (up 14% so far this year), are they too expensive to buy?
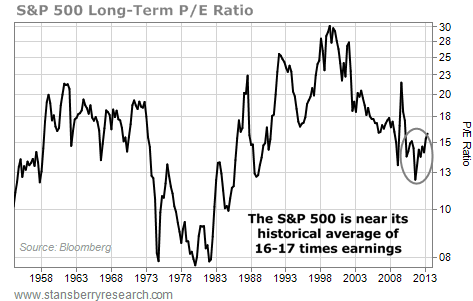
Below is the chart that provides our answer. It displays the historical price-to-earnings (P/E) ratio of the S&P 500. The P/E ratio is one of the time-tested ways to gauge stock market valuations. You'll note that the S&P 500's current P/E of around 16 is near its historical average of 16-17 times.

Remember... we're in the midst of an economic recovery with historically low interest rates. In that environment, stocks (especially ones returning cash to shareholders) should command a significant premium over their historical valuations.
Given that... stock valuations are on the cheap side.
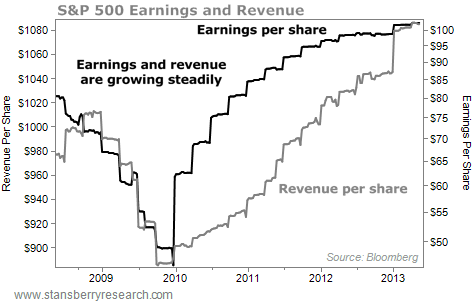
So if the market is hitting new highs but it's not overvalued on a P/E ratio... that tells me corporate earnings (the "E" in the P/E ratio) – the best possible indicator of the economy – are reaching new highs.
Corporate earnings started to rise in early 2010, when the potential for the Great Recession to turn into the Second Great Depression still loomed. Pessimistic commentators quickly credited this earnings growth to cost-cutting – that's not true growth. And they declared these earnings were unsustainable.
That's not the case anymore.
As you can see in the chart below, sales are growing steadily again, lending more proof to the sustainability of this recovery.

The profit margins for companies in the S&P 500 stock index have reached around 13.5%. That's about as high as they get. Companies are operating at peak efficiency, suggesting that creative accounting won't increase earnings figures from here... only true, organic growth will.
The market still has plenty of room to run. We aren't seeing as many values as we did two years ago, when stocks were priced at 12 times earnings and every fundamentally sound business looked cheap. But we still want to own stocks.
Conservative investors just want to be sure to own only the best names with the best prospects. This means world-class U.S. blue chips, like Wells Fargo, Microsoft, and Intel.
Despite all the negative stories you read in the mainstream press, the U.S. economy is gradually improving... stocks are still relatively good values... and earnings are growing. That's why it still makes sense to ignore the doomsayers and stay long U.S. stocks.
Here's to our health, wealth, and a great retirement,
Dr. David Eifrig
P.S. If you're ready to look at the numbers – and ignore conventional investing wisdom – you might be interested in a report I just put together. This isn't for folks who think becoming wealthy is a "get-rich-quick scheme." And it's not for folks who blindly follow the advice of a broker or money manager. But if you'd like to hear about unique ways to generate hundreds, even thousands, of dollars a month in extra income, click here.
The DailyWealth Investment Philosophy: In a nutshell, my investment philosophy is this: Buy things of extraordinary value at a time when nobody else wants them. Then sell when people are willing to pay any price. You see, at DailyWealth, we believe most investors take way too much risk. Our mission is to show you how to avoid risky investments, and how to avoid what the average investor is doing. I believe that you can make a lot of money – and do it safely – by simply doing the opposite of what is most popular.
Customer Service: 1-888-261-2693 – Copyright 2013 Stansberry & Associates Investment Research. All Rights Reserved. Protected by copyright laws of the United States and international treaties. This e-letter may only be used pursuant to the subscription agreement and any reproduction, copying, or redistribution (electronic or otherwise, including on the world wide web), in whole or in part, is strictly prohibited without the express written permission of Stansberry & Associates Investment Research, LLC. 1217 Saint Paul Street, Baltimore MD 21202
Disclaimer: The above is a matter of opinion provided for general information purposes only and is not intended as investment advice. Information and analysis above are derived from sources and utilising methods believed to be reliable, but we cannot accept responsibility for any losses you may incur as a result of this analysis. Individuals should consult with their personal financial advisors.
Daily Wealth Archive
|
© 2005-2022 http://www.MarketOracle.co.uk - The Market Oracle is a FREE Daily Financial Markets Analysis & Forecasting online publication.


