Dow, Gold and Jobs Up - The Fed’s Next Step!
Stock-Markets / Financial Markets 2013 May 06, 2013 - 09:06 AM GMT “When you're in jail, a good friend will be trying to bail you out. A best friend will be in the cell next to you saying, 'Damn, that was fun'.”― Groucho Marx
It was quite a week with the FOMC decision, the ECB rate cut and then Friday’s employment report so we have a lot to talk about. I want to start out discussing the jobs report as we saw that the U.S. economy created 165,000 jobs in April, and the unemployment rate fell to 7.5% from 7.6% even though the size of the labor force increased. What's more, hiring in March and February were revised up by a combined 124,000 jobs. The increase in hiring in April beat Wall Street's forecast for a 135,000 gain, with unemployment remaining at 7.6%. The decline to 7.5% puts the jobless rate at the lowest level since December 2008. Meanwhile, the number of new jobs created in March was revised up to 138,000 from 88,000, the Labor Department said, while February's figure was revised up to 332,000 from 268,000. The number of jobs created in February was the highest since November 2005 for any month that did not include temporary Census bureau hiring.
All of this is well and good but it’s still only half of the creation of 350,000 jobs per month Obama said we needed when QE was initiated way back in 2009. It also doesn’t resolve anything for the 496,000 people that simply dropped out of the work force in March. We have nearly 90 million Americans ages 16 or older not working, or looking for work. Adjusted for population growth, fewer Americans now work than at any time since 1979. Then there are the millions of people working who are considered to be unemployed. They’re earning close to minimum wage and considerably less than the used to five years ago. All in all nothing has really improved on the labor front if you simply dig down below the surface and look at what’s there!
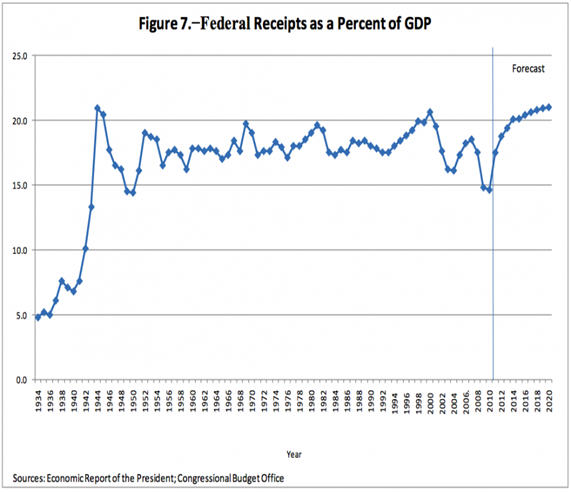
What’s going on with the US Federal Reserve is another story altogether. First a short review. When the crisis began back 2007 it quickly became apparent that we would need to see a combination of fiscal (taxes and government spending) and monetary (printing) policy in order to right the ship. As the Fed so kindly pointed out in its FOMC statement, we have no fiscal policy. An inept Congress and Senate see to it that no real decisions are ever made, and that will not change anytime soon. If you
look at this chart you’ll see that tax revenues have actually increase as a percentage of GDP, taking money out of the consumer’s hands. Then to make matters worse we now have the government sequestration that takes another US $85 billion off the table.
That leaves us with the Fed and it’s chosen path of monetary stimulus, or QE as it is called, where they go into the bond market and buy debt. During the first quarter the Fed purchased 72% of all new debt issued. QE has come in bits and pieces, each one greater than its predecessor, and I’ve pictured it below:
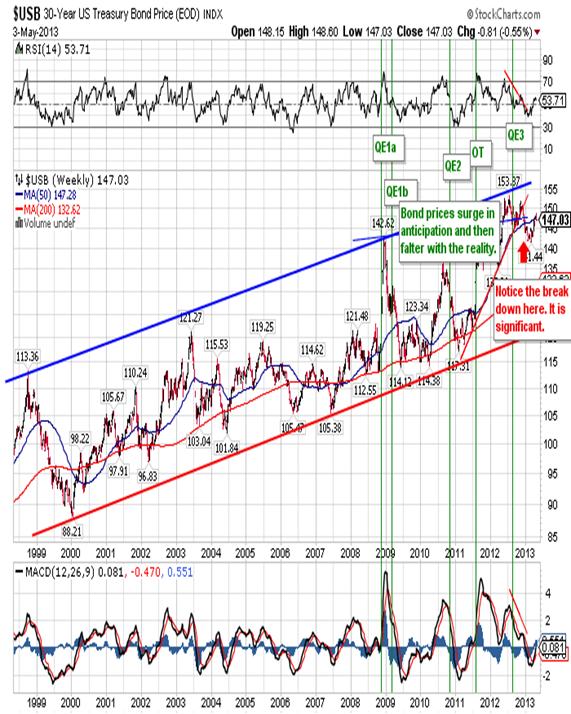
I framed QE in terms of the bond market because QE was/is designed to buy back US debt, and bonds are of course US debt. You’ll notice that each infusion has had a shorter shelf life, but that’s a story for another day.
This week a lot of people were expecting the Fed to come out and say that they were working on a plan to ease out of QE. This would mean less printing and higher interest rates. That didn’t happen! Instead the FOMC committee said that they were prepared to go either way. Here’s an excerpt:
“The Committee will continue its purchases of Treasury and agency mortgage-backed securities, and employ its other policy tools as appropriate, until the outlook for the labor market has improved substantially in a context of price stability. The Committee is prepared to increase or reduce the pace of its purchases to maintain appropriate policy accommodation as the outlook for the labor market or inflation changes.”
That’s the first time they admitted to the possibility that they might have to increase QE somewhere down the road. That’s a major change and I’m convinced that’s exactly what we’ll see before the end of the year. In other words the Fed will have to print even more money, and buy back even more debt, in order to keep the ship of state afloat!
Not to be out done the European Central Bank announced on Thursday morning that it decided to lower its benchmark interest rate by 25 basis points to 0.50%. ECB President Mario Draghi is under a lot of pressure to provide growth, and he’ll be forced to print a lot more before it’s over. By the end of 2012 the balance sheets of the world's largest central banks, the G20 nations and the Eurozone, totaled $17.4 trillion US, this according to Bank of Canada calculations:
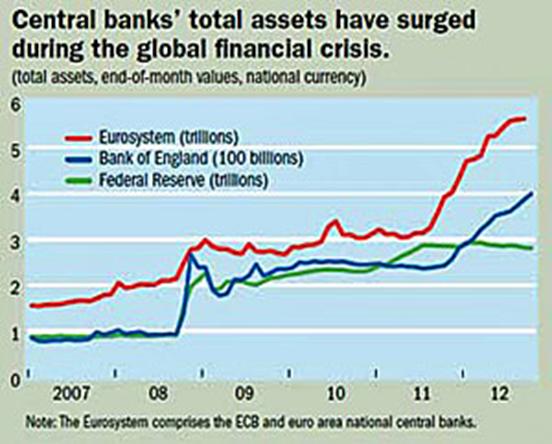
That is nearly a quarter of global GDP, and slightly more than double the $8.5 trillion these same institutions were holding five years ago.
The problem with both the Fed an ECB policy is that it simply has little or no affect on their respective economies. Europe in particular chose a truly stupid mix of austerity and expansionary monetary policy, the end result being shrinking economies while expanding debt loads! The Fed wasn’t much better as they printed money and gave it to banks in return for toxic debt. The banks in turn refused to loan money in a zero interest rate environment, choosing instead to deposit it back into the Fed and earn a small return with “no risk”. New debt was financed in much the same way so there was never any real increase in the money supply and inflation.
Now that the US economy is shrinking, we actually have deflation. Under Obama’s leadership overall government debt as a percentage of GDP has exceeded 100%:
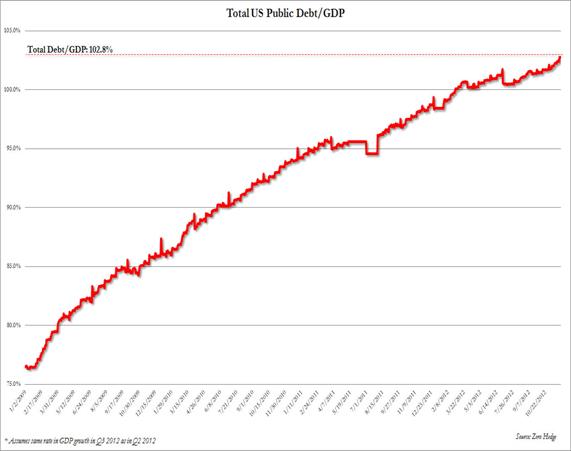
In terms of dollars and cents, the debt has increased from US $10.6 trillion to US $16.8 trillion over the same period. Then we have another US $90 trillion in unfunded obligations and US $1 quadrillion in derivatives floating around out there.
So while The Fed is printing more money and increasing debt, it is failing to create growth. To further complicate matters the per capita savings rate has fallen like a stone, from over 6% to 2.7% in just six months. The Fed is now to the point that conventional monetary expansion, printing to buy debt, is unproductive. That means the Fed will be forced to revert to a little known tool called overt monetary stimulus whereby it simply prints money and gives it to the Department of the Treasury without requiring the Treasury to issue new debt. This is as close to dropping money out of helicopters as you can get without actually using a helicopter.
I predict this will in fact happen but first we’ll see a new and bigger round of the more conventional QE, probably before the end of this year. Of course it will change little since the amounts of the buy backs are just a small fraction of all the debt out there, and it’s an unproductive use of funds. Why have another round of QE if we know it doesn’t work? The Fed is playing for time, and maybe hoping for some sort of miracle along the way! With one more round of QE it can try to keep the wheels on the bond market without pressuring the dollar lower. Since the dollars the Fed prints goes to buy old and new debt, and the banks simply deposit the money received back in the Fed, the dollar is steady as she goes and that keeps our foreign lenders from getting to nervous.
Here you get a picture of the dollar’s behavior going back to January 2012:
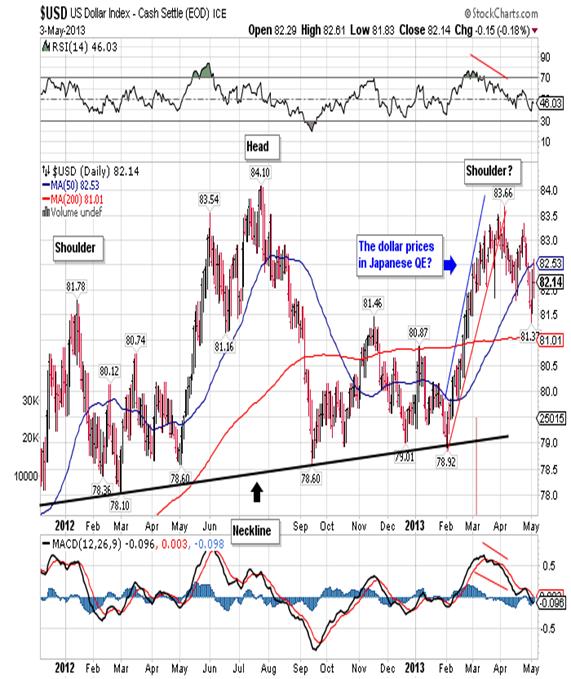
The good news is that the greenback has moved sideways over the last sixteen months. The bad news is that it appears to have formed a head-and-shoulders formation in the process. Finally, what you can’t see is the massive printing going on in Japan that serves to artificially prop up the US dollar.
Why is the dollar so important? In a zero interest rate environment there would be absolutely no incentive to hold dollar denominated assets if the dollar begins to fall. So the Fed has to print without devaluating the dollar, but now that the economy is slowing that dog won’t hunt for much longer. Aside from that we have the Fed buying
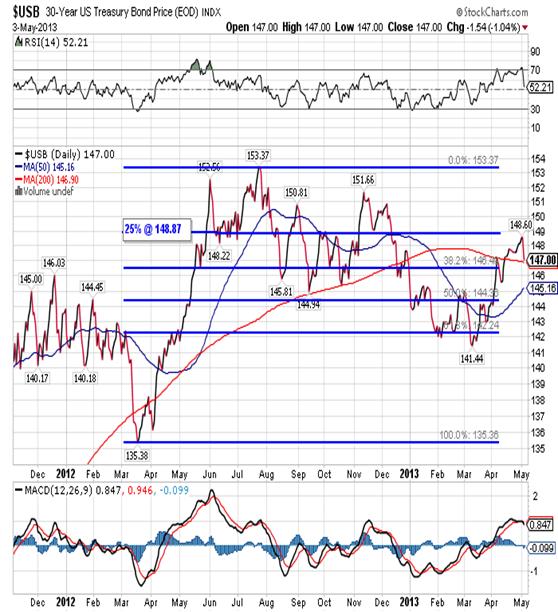
more than 70% of all bond issues and yet bond prices are falling as you can see in the chart above. Falling bond prices mean that interest rates are rising, and that is something a debt-laden economy cannot afford.
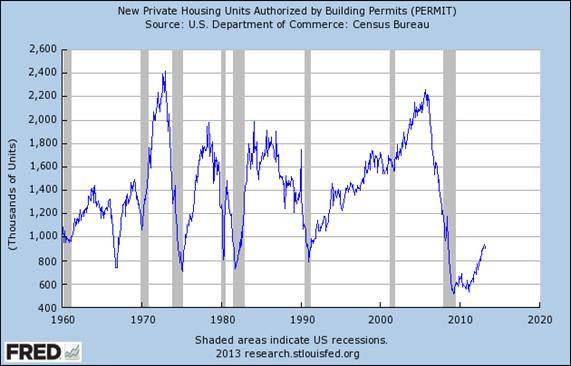
As I mentioned earlier the Fed really needs to buy time with another round of QE. Meanwhile it needs to support the dollar and bonds for as long as it can and pray that somehow the economy turns around. How can you support a currency that has been declining since 2001 and a bond that appears to have topped out ten months ago? If both continue lower from here it wouldn’t take long before we’d see a crisis in confidence. Another part of this buying time process involves the blowing of bubbles. For about the last year or so the media and the Fed have been focusing on the “rebound in housing”:
Although it’s true that housing permits have been on the rise, they are still historically quite low. Furthermore you need to keep in mind that this is a lagging indicator. For a more accurate view of the future of housing you would be wise to look at a weekly chart of lumber prices:
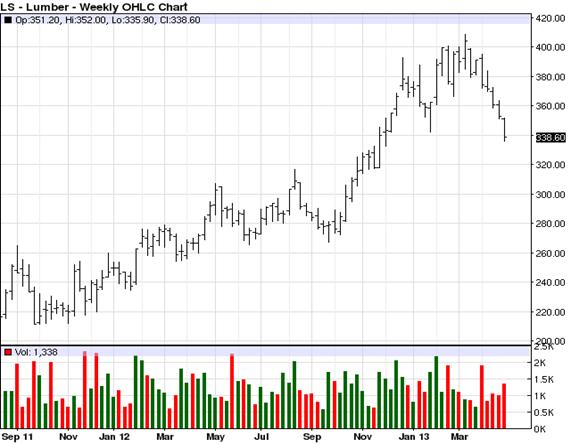
Here you can see that lumber prices, a forward looking barometer, turned down at the beginning of March and have dropped close to 20%. So the price of lumber is telling you that the miniscule recovery is housing may already be over and done with.
Perhaps the best known and most reoccurring of all bubbles is the stock market. It died a notorious death in 1999, rose like the phoenix from the ashes to reach new heights in 2007. Then came an even more spectacular fall and now an even grander recovery as the Dow hit 15,000 on Friday. Why is the Dow so important? It’s where you have your IRA’s and pension funds along with your hopes and dreams for a peaceful and plentiful old age. As anyone who doesn’t live in a cave knows, the Dow has made a series of new all-time highs and the trend is clearly higher:
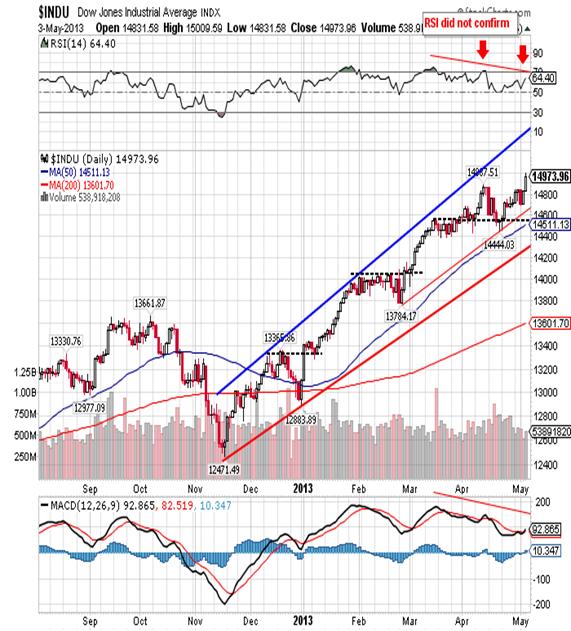
Here you can see the current leg higher and I’ve highlighted how in lieu of a pullback we’ll see a sideways movement allowing for consolidation of prior gains. This consolidation leads to a break out to the upside and a run to yet another new all-time closing high.
We occasionally see some scary three and four day reactions, but it doesn’t force anyone out of the market because everybody goes to sleep firm in the belief that the Fed has their back! This is obvious when you look at a chart of the VIX:
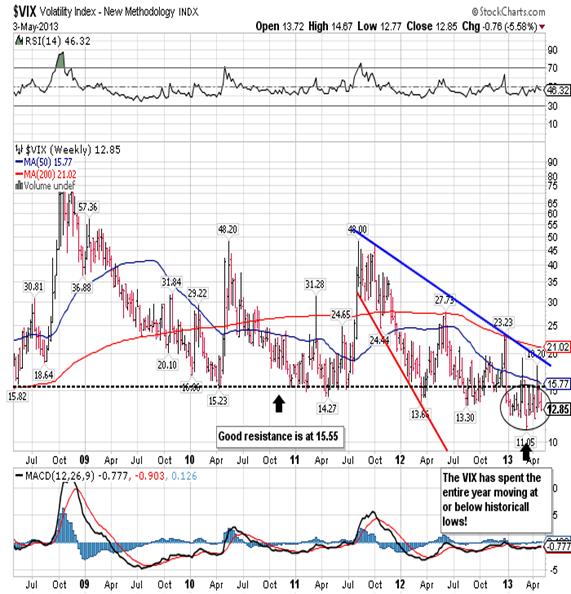
The VIX tells you when traders are getting nervous and want to buy insurance that protects them against any substantial downward movements. You can see in the chart above that the VIX has been trading at or below historical lows all year, meaning no one is worried. They’re not worried because they know the Fed will support the market.
The Dow is the canary in the coalmine and as long as you can read in the Sunday paper that it traded at 15,000 for the first time ever, people will believe that all must be right in the world. No one seems to care that only 1% of the people benefit from 95% of all the gains in the Dow. It’s the perception that everything is okay that really counts. Obama and Bernanke can go on TV and say, “See, I told you everything is okay! The Dow just made a new all-time high.” What’s more the Dow is the only game in town since bonds pay a negative real interest rate and cash pays nothing and is subject to central bank induced devaluations. Funds and even central banks are forced to load up on stocks in search of elusive returns and that drives the market higher.
The final piece of the Fed’s puzzle is gold. It is absolutely vital to the Fed’s plans that the price of gold is driven down into submission. A declining gold price supports the US dollar since it is a direct competitor and a store of value. If gold is headed lower it means that all is right with the world and it forces investors into the “safe haven” investments of US bonds and stocks. Three weeks ago we saw a concerted unified effort to break the back of the bull market in gold as price broke $240 in just two days.
As a result of the take down, gold traders are the most bearish in three years after investors sold a record amount of metal held in exchange-traded products and prices tumbled in what many believe is a new bear market for the yellow metal. Yet as you can see in this chart, the decline is nowhere near the decline we experienced back in 2008:
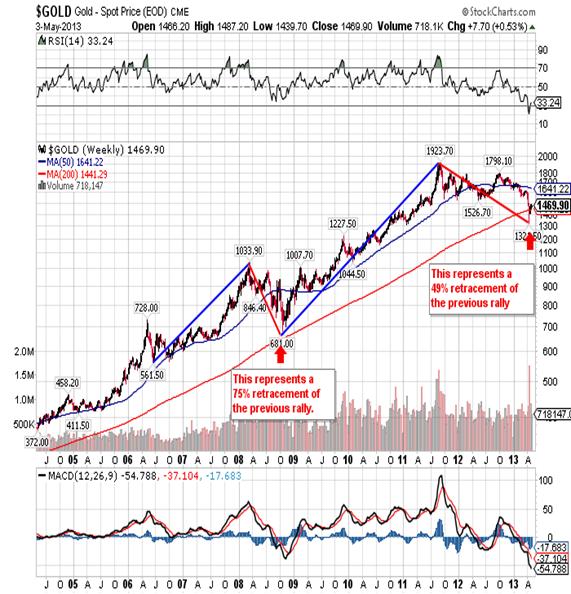
Of course that doesn’t get any airtime and instead we have daily segments on why gold should be avoided. The decline produced never before seen readings of 15 in RSI while MACD made all-time lows. On Friday spot gold closed at 1,469.90 and more than $140 above the April 16th 1,321.20 intraday low, but the mood among investors is still black as night.
The decline on the price of gold is part and parcel to the Fed plan because it eliminates alternatives to the stock market while at the same time giving support to the US dollar and bond market. Perhaps more importantly it allows the puppet masters to accumulate the only true store of wealth at ridiculously cheap prices. Like every ill-conceived plan there are always flies in the ointment. In order to suppress the physical demand for gold the Fed used the paper (futures) market to push the price down. They pushed it so far that buyers, including central banks in China, Russia and India found physical gold too cheap to ignore, so physical demand surged. In order to avoid a disconnect between the physical market and the paper market, the Fed had to cease with the raids.
I am convinced that the Fed’s goal was to push price all the way down to strong support at 1,089.50, more that $250.00 below the actual cost of mining an ounce of gold, in an effort to accomplish their goals. Unfortunately the jump in physical demand near the 1,303.30 support caught them off guard. Now it remains to be seen if the Fed will make one more attempt to push prices down to 1,089.50. As you can see in the following chart, the recovery is at a critical stage as it is testing the resistance at 1,470.50, a 50% retracement of the recent decline:
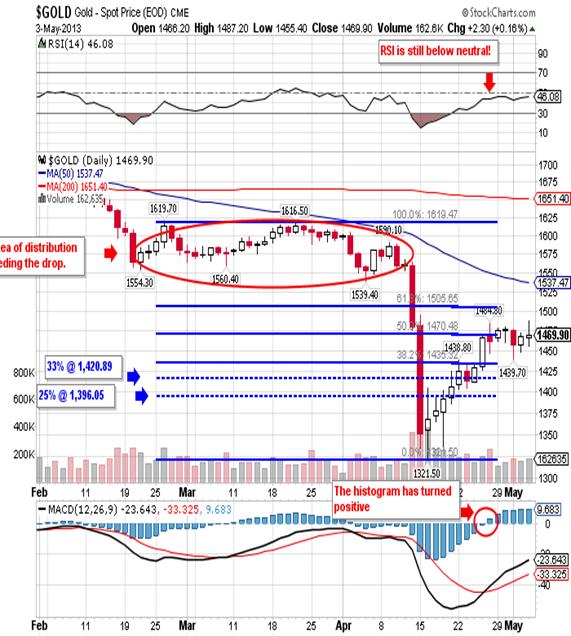
You can see a sideways movement has developed over the last week, and it begs the question as to whether or not this is accumulation or distribution? In spite of the recovery RSI is still below neutral at 46.00 and MACD is still moving below old lows. This sideways movement is in a range that runs from 1,450.00 on the low side to 1,485.00 on the high side. As soon as price approaches 1,460.00 we see buyers run into the market and a bounce follows.
Whether or not we see another attack on gold all depends on how desperate the Fed is right now. As much as the Fed wants lower gold prices to prop up the dollar, it also wants to avoid a crisis of confidence. If a disconnect were to occur between the paper and physical markets for gold, it would lead to a crisis in confidence that would affect the dollar, the bond and the stock market. Are things so bad that the Fed is willing to run the risk? I don’t know but we’re about to find out, as I don’t believe this sideways movement can go on for more than another session or two. As most of you know I sold the break of strong support at 1,522 short and covered at 1,345.00. I also bought physical gold for clients at 1345.00, 1367.00 and again at 1,404.00 so I believe that there is a better than good chance the low is in.
I currently have a small short position in June gold at 1,481.00. but this is not a hedge. I have accumulated physical gold since 2003 and I do not hedge it for the simple reason that it is a store of wealth and I know it will be much higher in a year or two. What I do in the paper market is designed to make profits in the here and now. I was long paper gold from 1,367.00 until it reached 1,470.00 where I took profits. Then I went short looking for a pullback to the 1,420.00 to 1,435.00 area. Gold fell to 1,439.00 and I covered at 1,441.00. Now I am short from 1,481.00 and will stay that way until gold can either move up through the 1,470.50 resistance with authority or I will add on if it breaks down below 1,455.00. Meanwhile there is nothing to do but watch.
Without a doubt gold is the best investment you can make right now and it’s cheap, but that doesn’t mean it can’t get even cheaper. Is the bull market in gold over? No, and it won’t be even if it does fall another $200.00; it will just be absurdly cheaper and I will have to buy even more physical gold. With that said it won’t stop me from selling paper gold short should gold break down one more time. Profits are profits whether they come from the long side or the short side. Normally I would look at a chart like gold’s and tell you that the price has to head higher, but manipulation (corruption) make that call a lot tougher. With that said I feel that 1,420.00 should hold here and there’s an off chance that we’ll retest the lows from a couple of weeks ago. The only way that gold goes to 1,100.00 from here is if things are a lot worse than even I imagine.
CONCLUSION
What a difference a few months make! Six months ago a gain of 165,000 jobs would have been a disappointment because we were looking for 250,000 or more. Now we get an increase of 165,000 jobs and the Dow jumps 150 points. They drink Cognac on Bloomberg to celebrate! What if anything changed to make lesser appear to be more? I can answer that in one word, spin!They have to spin the trivial in order that it appear to be substantial, just like they’ll spin Dow 15,000 into a growing US economy where all is well.
The Inclusion of the word “increase” in the FOMC decision is a real game changer. Also, they’re laying the groundwork for the assignment of blame by saying that we are lacking fiscal policy and the Fed can only do so much. Bernanke will do everything possible to keep all the balls in the air until he’s out the door. His probable successor, Janet Yellen, is a supporter of QE and will be left with an almost impossible task of keeping rates at zero while paying all the bills.
Meanwhile the gap between the have’s (Germany) and the have not’s (Spain, Greece, et al…) is growing and austerity is only increasing that gap. I suspect that gap will be closed with a combination of a series of write-offs and violence. The same goes for the US as 95% of the gains on Wall Street go to the top 5% of the population. Meanwhile real wages and hours worked, the bread and butter of the “other” 95% continue to decline. The laws are being changed to limit your freedom, your IRA’s and pension funds will be seized, and you’ll be given government bonds that pay negative real rates of return. In the end you’ll have a health care system and a pension plan run by the State that will be completely inefficient as all state run programs are.
The real problem, debt, will increase exponentially and the printing press simply won’t be able to keep up. You simply can’t print fast enough to service more than US $1.2 quadrillion in debts, much less make it disappear! In the end the markets will do what they do best, clean house! Civil unrest will aid the process and only then will we see real change. The Fed and their printing press are the only thing holding it all back and gold is your only salvation, assuming you can hang on to it once the manure hits the fan. Most of you won’t. The brown shirts will come knocking on your door at 4 am, demanding that you give up your gold if you want to keep your liberty.
It might interest you to know that there is a new $1 million dollar program led by Palm Beach County Sheriff Rick Bradshaw aimed at “violence prevention” by encouraging Floridians to report their neighbors for making hateful comments about the government, a chilling reminder of how dissent is being characterized as an extremist threat. What constitutes a “hateful comment” is completely subjective and overlooks the fact that most humans tend to embellish when telling a story. Of course you’ll be in Gitmo charged with domestic terrorism and denied all due process because you gave up your rights a long time ago! Like the complacency we see in the stock market, it permeates all facets of our life. The cost of eradicating complacency will be extremely high but unavoidable.
In conclusion, don’t expect much to change in the way of policy. In Wednesday’s FOMC statement, the Fed noted that ”… fiscal policy is restraining economic growth.” This is Fed speak charging that Washington is acting irresponsibly, thus the Fed needs to possibly increase both its bond and mortgage backed securities purchases. In short the Fed has become a one trick pony; whatever the question is, QE is the answer. When it becomes blatantly obvious that QE no longer works, then we’ll shift to overt monetary stimulus. At that instant the rest of the world will come to the immediate conclusion that the dollar and bond are doomed and we’ll see flash crashes across the board. Gold and the Swiss Franc will rocket higher and you’ll be left to wonder why you never got out of the way of that freight train you saw coming from miles away.
Robert M. Williams
St. Andrews Investments, LLC
Nevada, USA
Copyright © 2013 Robert M. Williams - All Rights Reserved Disclaimer: The above is a matter of opinion provided for general information purposes only and is not intended as investment advice. Information and analysis above are derived from sources and utilising methods believed to be reliable, but we cannot accept responsibility for any losses you may incur as a result of this analysis. Individuals should consult with their personal financial advisors.
Robert M. Williams Archive |
© 2005-2022 http://www.MarketOracle.co.uk - The Market Oracle is a FREE Daily Financial Markets Analysis & Forecasting online publication.


