Missed Opportunity For Stock Market Bears
Stock-Markets / Stock Markets 2013 May 06, 2013 - 08:44 AM GMTBy: Andre_Gratian
 Current Position of the Market
SPX: Very Long-term trend - The very-long-term cycles are in their down phases, and if they make their lows when expected (after this bull market is over), there will be another steep decline into late 2014. However, the severe correction of 2007-2009 may have curtailed the full downward pressure potential of the 40-yr and 120-yr cycles.
Intermediate trend - SPX has again delayed is intermediate correction. A new potential target price provided by P&F chart analysis has been set for the top.
Analysis of the short-term trend is done on a daily basis with the help of hourly charts. It is an important adjunct to the analysis of daily and weekly charts which discusses the course of longer market trends.
MISSED OPPORTUNITY FOR THE BEARS
Market Overview
An intermediate cycle was due to make its low in the past week, but its effect on the market was countered by strong economic news. First, the ECB lowered interest rates on Thursday, and there was a better than expected jobs report on Friday. This caused the SPX to go past it's 1600 target and triggered some short-covering by those that had expected that level to be the high of the move.
From a cyclical standpoint, that intermediate cycle is now moving up and should support prices until the next cycles which are due in mid-May and around the first of June, start exerting downward pressure. The yearly cyclical pattern which normally produces the "Spring slump" so far appears to be without teeth. My guess is that it will have a delayed start, and perhaps its effect will continue beyond early June. EW analysts seem to be in agreement that SPX is now expanding its 5th wave from 1343, which means that, from a structural standpoint, price is likely to move higher and complete its current pattern before correcting.
Since the breakout above 1600 has turned a potential distribution pattern into accumulation, we can now estimate at what level the SPX will make its next high. This projection is confirmed by an expanded base count which, originally, had the market topping at 1600. The price target would in all probability coincide with the top of wave 5 from 1343 and become the intermediate high that we had expected to occur sooner. But, although the coming correction will the most significant one since the uptrend started at 1343, it will not mark the beginning of a new bear market. I have stated before that SPX has higher long-term projections and this is validated by the "SentimenTrader" which, even after the strength displayed by the market over the last few months, only has a neutral reading.
The NDX, benefiting from the positive action of the semi-conductor sector, is trying to return to its traditional leadership role which had been tarnished by the deep correction of AAPL. Now that AAPL seems to have found a (temporary?) bottom and is no longer a negative influence, the positive components of the NDX have been able to boost its relative performance. Russell 2000, another leading index which had been showing some relative weakness, also managed to make a new uptrend high on Friday. However it does remain weaker than the rest of the indices and will probably, once again, lead the market into the next correction along with the NDX when the latter starts to show some weakness.
Chart Analysis
Let's start with the NDX which is attempting to reclaim the role of leading index with a significant price surge from a low of 2731 on 4/18 to Friday's high of 2952 -- a period of only three weeks. The daily chart has interesting features which could have some implications when we try to determine the market position.
Let's assume that before the uptrend ends, NDX in its characteristic leading role will already be showing some relative weakness to SPX along with Russell 2000. We've already decided that SPX will most likely rise a little higher before completing its trend. On the other hand, there is a good possibility that NDX made a blow-off pattern on Friday, complete with exhaustion gap. It would be even more convincing if NDX hangs above the gap for a couple of days, and then creates an island reversal by gapping on the downside when SPX starts its wave 4 (of 5) correction. That action would be a strong signal that the index has started a correction and that SPX won't be far behind.
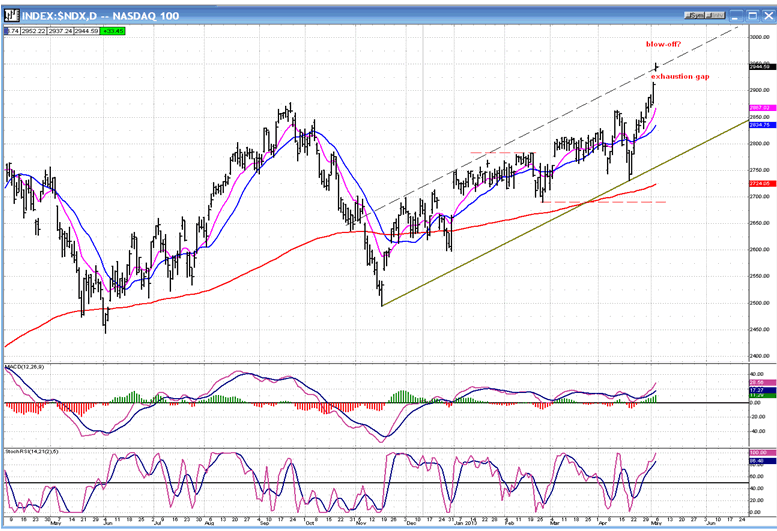
Reinforcing that possibility, QQQ appears to have met a P&F target on Friday. That would not be the final high for the index, but the higher level may not be attained until after the SPX has corrected its trend from 1343. The indicators are still in an uptrend, suggesting that the price may not roll over immediately, allowing time for an island reversal to form - although this is only speculation, at this point.
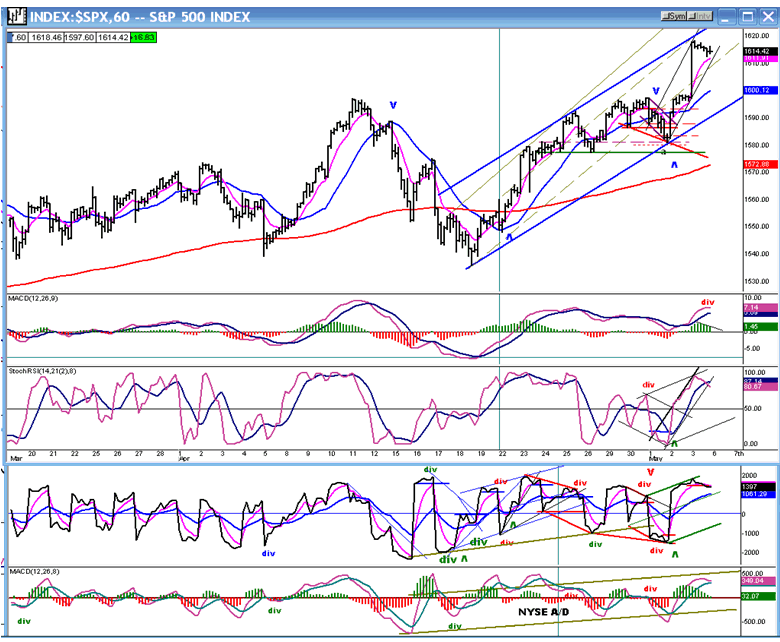
The SPX hourly chart shows clearly the channel which delineates wave 5 and which should come to an end when it is penetrated on the downside. On Friday, SPX moved all the way to the top of the channel where it met with resistance and started to correct in what is probably wave 4 of the move which started at 1581. When it is complete, we'll probably go for wave 5 and have another correction before we finish wave 5 of 5 and the move which started at 1343.
The hourly indicators, which have begun to roll over, should show some negative divergence on the next small up-wave, and this will precede a minor correction in the averages. The daily indicators remain well below their peaks in spite of new highs in the averages - except for the QQQ indicators which made new highs with the price, including the NASDAQ A/D index. I am not sure if that nullifies Friday's price move as a potential blow off pattern. We'll see.
Cycles
"Around May 1, a Kress intermediate cycle is due as well as a 29-day cycle." These did cause a 14-point decline on that date, but it was reversed by the same amount on the next day.
The next 7-wk cycle low is due in the third week of May and, around June 2, the 29-wk cycle should bottom, perhaps coinciding with the bottoming of the yearly cycle to end the correction -- or not! There are several historical precedents with the low coming in July
Breadth
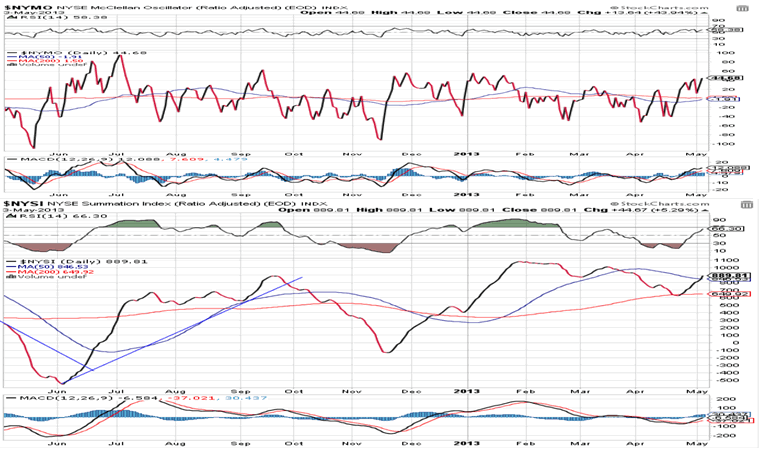
The McClellan Oscillator and Summation Index are shown below (courtesy of StockCharts.com).
The McClellan Oscillator has become positive again and is holding in that sphere. This has allowed the Summation index to turn up and start another uptrend with no sign of weakness showing yet, confirming the view that more market uptrend is still ahead.
Sentiment Indicators
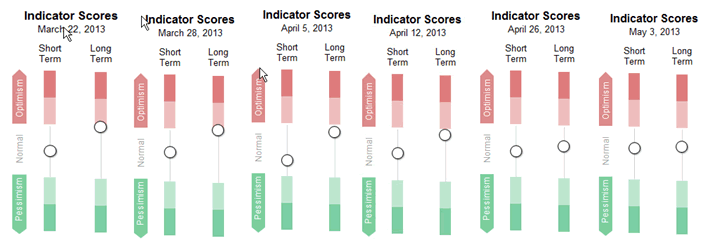
For the second week in a row, the SentimenTrader (Courtesy of same) remains completely neutral with both the short and long term in the middle of neutral. It is not possible to have a significant market top with this kind of reading. Let's see what happens over the next couple of weeks.
VIX
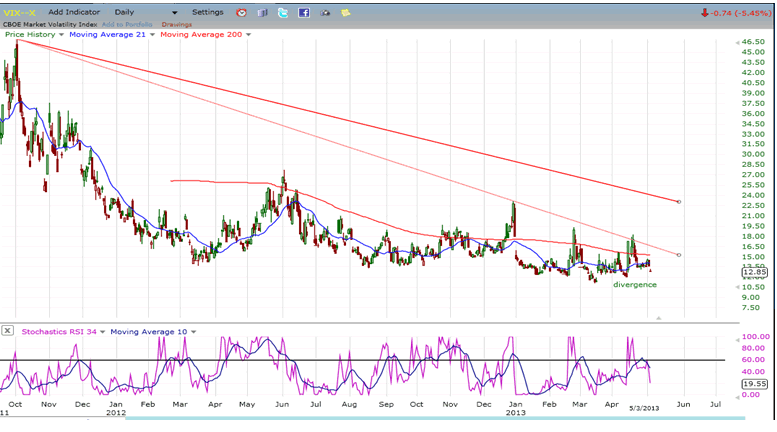
I have kept the following almost verbatim from last week because it still applies: In a bull market such as the one we are in, there is a consistent pattern in the VIX which precedes corrections: the index starts to make a series of higher highs and higher lows which result in a rounding bottom. We saw this in March-April 2012 and again in October-November-December of the same year. Both of these occurred just before sizeable corrections in the market. It looks as if the same pattern started in March of this year and has continued throughout early May.
This pattern is accompanied by increasing positive divergence in the VIX as it approaches the beginning of the correction (this is also manifest in the present VIX action). Of course, this warning must follow through with continued higher highs and lows as the market corrects. Is VIX again forecasting a significant correction? Confirmation should come when it makes a new short-term high.
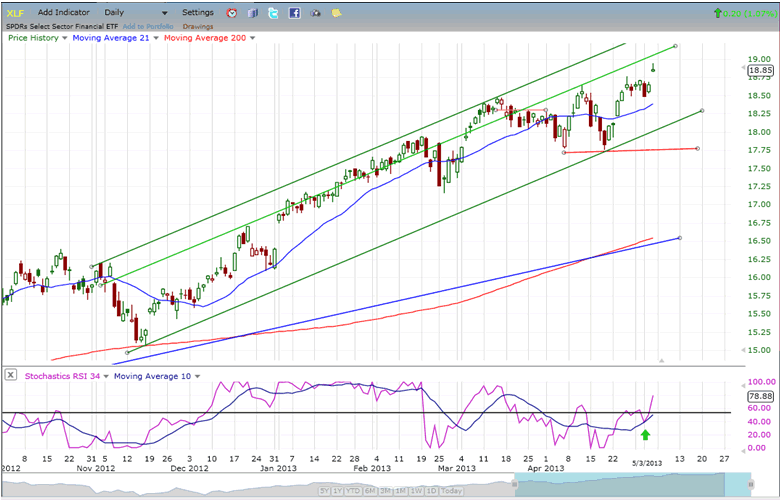
XLF (Financial SPDR)
XLF continues to move in sync with the SPX. This is not a sign that a correction is imminent. Normally, this index signals that a reversal is near when it starts diverging from SPX. Since this is not yet happening, it supports the premise that there are higher prices ahead before the uptrend from 1343 comes to an end.
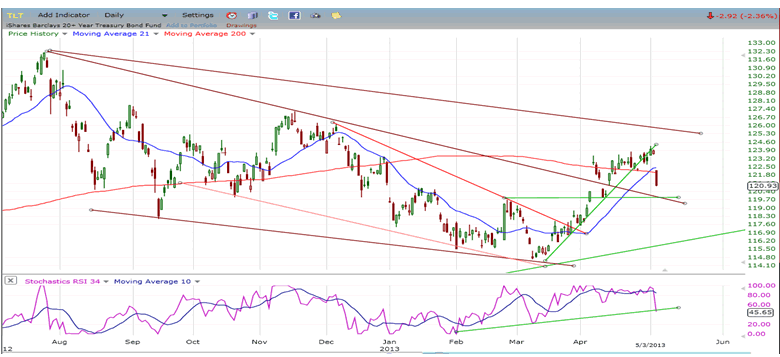
BONDS
By selling off on Friday, TLT is also confirming that higher prices are likely in the equities market. There is immediate support for this index a point or two below consisting of a former short-term top (green line) and the former downtrend line which was decisively broken. Pulling back to it should provide a back-test of that broken trend line. A good area for TLT to consolidate before it attempts a break-out of its major corrective channel in conjunction with the next market correction would be between 119 and 121.
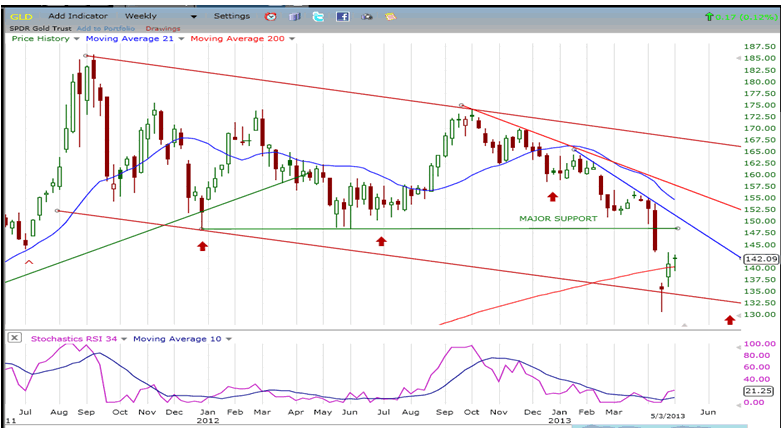
GLD (ETF for gold)
The weekly chart of GLD is best at showing the long-term corrective pattern in which the index is probably trapped for some time to come. The most immediate resolution to this correction could come in June at the next low of a very consistent 25-wk cycle. Whether the index remains within the channel or drops to a new low remains to be seen. GLD has a P&F projection down to 127, but it may not come right away.
UUP (dollar ETF)
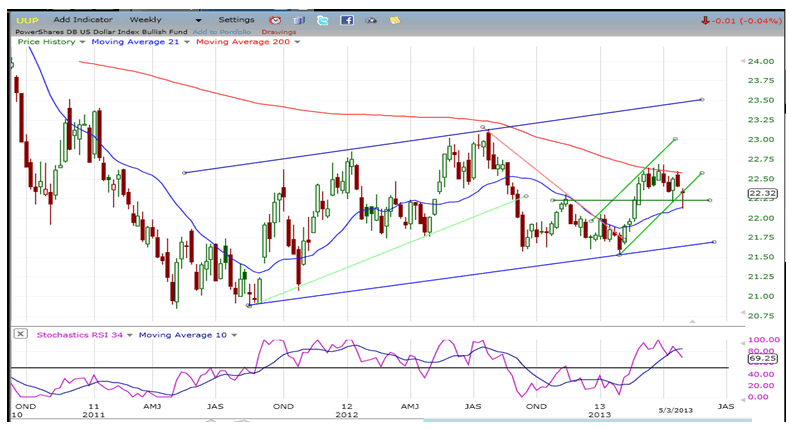
Looking at UUP's action with the help of a weekly chart also provides the best long-term view of this index. It has slowly been making its way higher since its November 2011 low. What we are presently witnessing is a short-term correction in an uptrend which should eventually resolve itself higher. The P&F chart gives UUP a count to 23.30. There is nothing showing in the index's behavior that says that it will not be able to reach that target.
USO (United States Oil Fund)
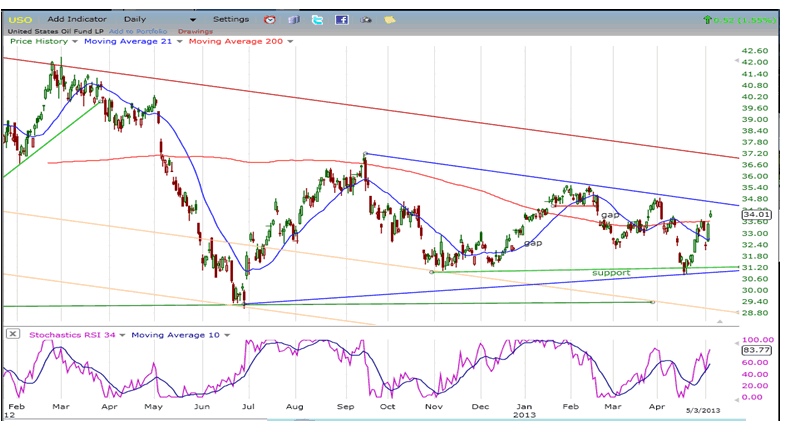
Since the last one did not work out, one could argue that USO is extending its triangle pattern, but that is only speculative at this point. If USO goes beyond the upper blue line and overcomes the next short-term high, it will nullify the pattern completely and we will have to re-evaluate its intentions. Before saying anything definite, let's see if it can rise above 34.90.
Summary
SPX missed an opportunity to correct along with an intermediate cycle which bottomed last week. The cycle's influence was offset by two strong economic reports, enabling the index to surpass its 1600 target and continue its uptrend to the next projection. A new structure will now have to be completed and, if this completion matches the next price target, that will be a good time to look for that elusive intermediate reversal of the trend which started at 1343.
FREE TRIAL SUBSCRIPTON
If precision in market timing for all time framesis something that you find important, you should
Consider taking a trial subscription to my service. It is free, and you will have four weeks to evaluate its worth. It embodies many years of research with the eventual goal of understanding as perfectly as possible how the market functions. I believe that I have achieved this goal.
For a FREE 4-week trial, Send an email to: ajg@cybertrails.com
For further subscription options, payment plans, and for important general information, I encourage
you to visit my website at www.marketurningpoints.com. It contains summaries of my background, my
investment and trading strategies, and my unique method of intra-day communication with
subscribers. I have also started an archive of former newsletters so that you can not only evaluate past performance, but also be aware of the increasing accuracy of forecasts.
Disclaimer - The above comments about the financial markets are based purely on what I consider to be sound technical analysis principles uncompromised by fundamental considerations. They represent my own opinion and are not meant to be construed as trading or investment advice, but are offered as an analytical point of view which might be of interest to those who follow stock market cycles and technical analysis.
Andre Gratian Archive |
© 2005-2022 http://www.MarketOracle.co.uk - The Market Oracle is a FREE Daily Financial Markets Analysis & Forecasting online publication.


