


How a Fibonacci Cluster Showed an Important Resistance Level in Gold
Commodities / Gold and Silver 2013 May 03, 2013 - 05:15 PM GMTBy: EWI

 Senior Analyst Jeffrey Kennedy shares techniques that helped spot a trading opportunity.
By Elliott Wave International
If you use Elliott in your technical analysis, you may already use Fibonacci ratios to determine targets and retracement levels in your charts.
But have you heard of "Fibonacci Clusters?"
Elliott Wave Junctures editor Jeffrey Kennedy shares his charts to illustrate this technique, which he recently used to identify a critical turning point in Gold. The following lesson is adapted from his March 26 video. Get more lessons from Jeffrey in the free report, 6 Lessons to Help You Spot Trading Opportunities in Any Market.
Performing multiple Fibonacci calculations of a price move often yields concentrations of Fibonacci levels, which act as barriers to price moves.
How do you create a Fibonacci Cluster of support or resistance?
In the following chart, you can see how to draw a line from the most recent swing high to the relevant low� and then connect previous higher highs to the same pivotal low. In the rectangular box, notice where the advance in GCA reversed from a cluster:
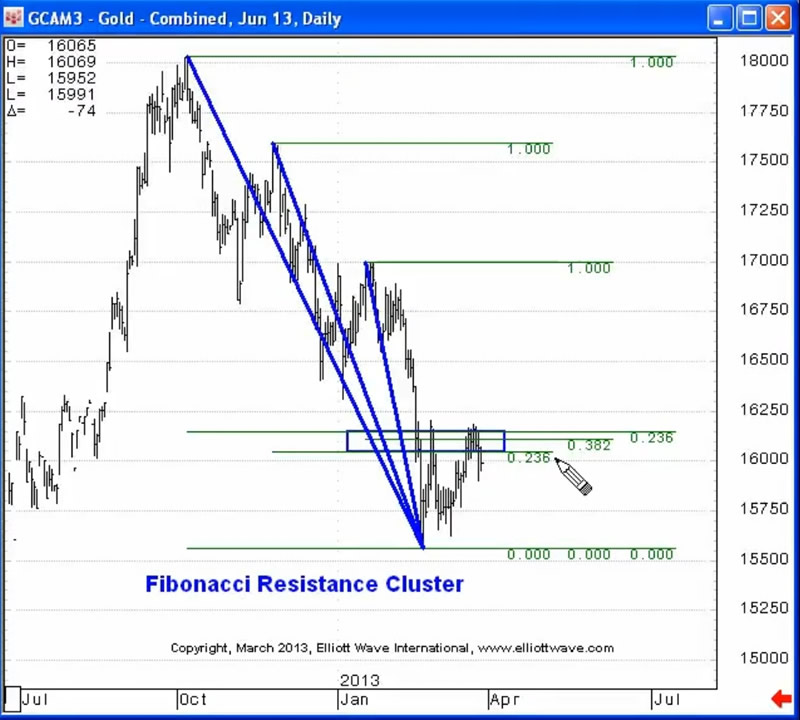
Kennedy covers other examples to explain how slingshots, reverse divergence and positive/negative reversals highlight the same momentum signature:
A bullish slingshot forms when prices make higher lows while underlying momentum surpasses previous extremes. Conversely, a bearish slingshot occurs when prices make lower highs while momentum exceeds prior readings.
In subsequent days, Gold prices fell to below $1550.
|
Learn How You Can Use Fibonacci to Improve Your Trading If you'd like to learn more about Fibonacci and how to apply it to your trading strategy, download the entire 14-page free eBook, How You Can Use Fibonacci to Improve Your Trading. EWI Senior Tutorial Instructor Wayne Gorman explains:
See how easy it is to use Fibonacci in your trading. Download your free eBook today >> |

This article was syndicated by Elliott Wave International and was originally published under the headline How a Fibonacci Cluster Showed an Important Resistance Level in Gold. EWI is the world's largest market forecasting firm. Its staff of full-time analysts led by Chartered Market Technician Robert Prechter provides 24-hour-a-day market analysis to institutional and private investors around the world.
About the Publisher, Elliott Wave International
Founded in 1979 by Robert R. Prechter Jr., Elliott Wave International (EWI) is the world's largest market forecasting firm. Its staff of full-time analysts provides 24-hour-a-day market analysis to institutional and private investors around the world.
© 2005-2022 http://www.MarketOracle.co.uk - The Market Oracle is a FREE Daily Financial Markets Analysis & Forecasting online publication.