


Gold Bugs Fantasizing About Disconnect Between Paper and Physical Gold
Commodities / Gold and Silver 2013 Apr 28, 2013 - 06:22 PM GMTBy: Clive_Maund

 Gold's post-plunge rally of the past 9 trading days has been quite impressive, given what preceded it, but it has not vitiated the implications of the support failure and plunge, and it won't until either a substantial base pattern forms, or the price breaks back above the strong support that has now become strong resistance. The chance of the latter happening over the short-term is low, and with the price now up within sniffing distance of the resistance, gold is viewed as being at a good point for traders to short it for a retreat back towards the recent lows, at the least.
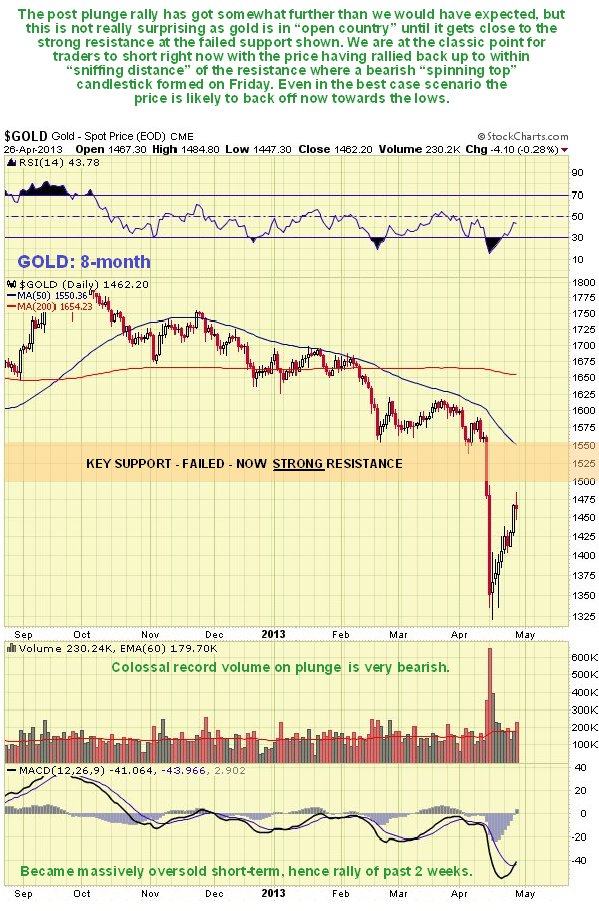
We can see the latest action clearly on the 8-month chart. The price has risen an impressive $150 off the lows, but this rebound has brought it up perilously close to the wall of overhanging supply from the trapped traders above the failed support and to its 50-day moving average now falling quite steeply overhead. Thus it is interesting to observe the appearance of a bearish 'spinning top' candlestick on the chart on Friday, which is a warning that it is probably on the point of reversing to the downside. The massive record volume on the plunge remains a bearish omen as does the volume pickup on Friday's intraday reversal. The rebound has served to unwind the extremely oversold condition resulting from the plunge, and has thus restored downside potential. Gold is thus viewed as a trading short here.
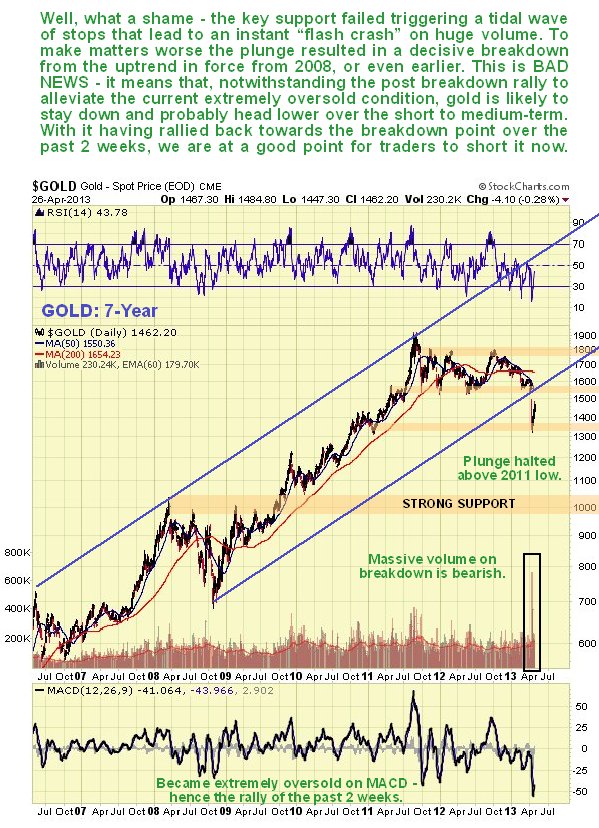
The 7-year chart reminds us that gold not only broke down below key support when it plunged, but also broke down from the long-term uptrend in force from 2008, or 2006 if you use its top line, on massive record volume, and it is hard to view this as anything other than a bearish development. We can also see on this chart that the plunge halted just above gold's early 2011 low, and failure of this low can be expected to lead to a further severe decline back to strong support in the $1000 - $1050 area.
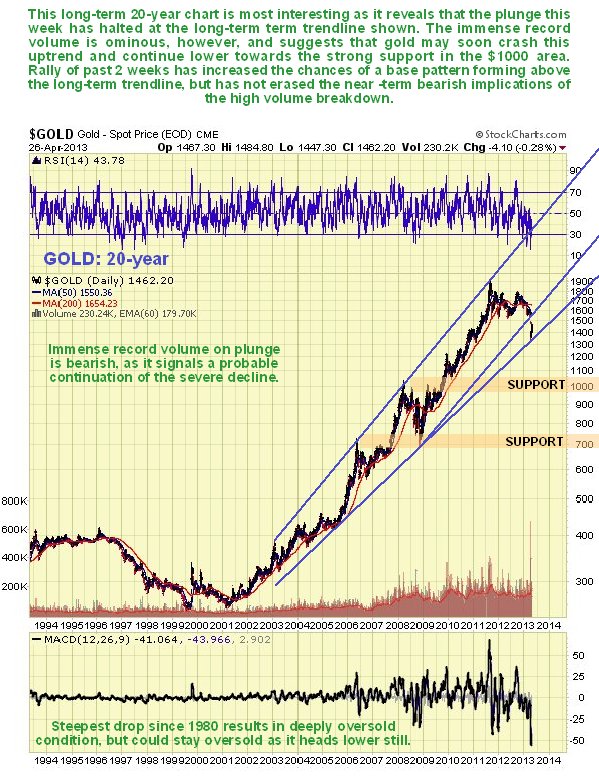
The long-term 20-year chart for gold is most interesting as reveals that the plunge halted right at an important long-term trendline. If this trendline holds it could reverse to the upside from about the current level. The problem is that the huge volume on the plunge and the preceding Big Money rundown of physical inventory suggest that this trendline will fail, and sadly if that happens then we will have no choice but to label gold as being in a bear market, although it's not sad at all of course if you are a bear. We should keep in mind however that a drop to the $1000 - $1050 area could be followed by a turnaround and a major new bullmarket phase that sees gold ascend to clear new highs and then go parabolic, which would mean that the current convulsion is similar to what happened in the mid-70's which at the time was labeled a bearmarket. This scenario is suggested as likely by the COTs.
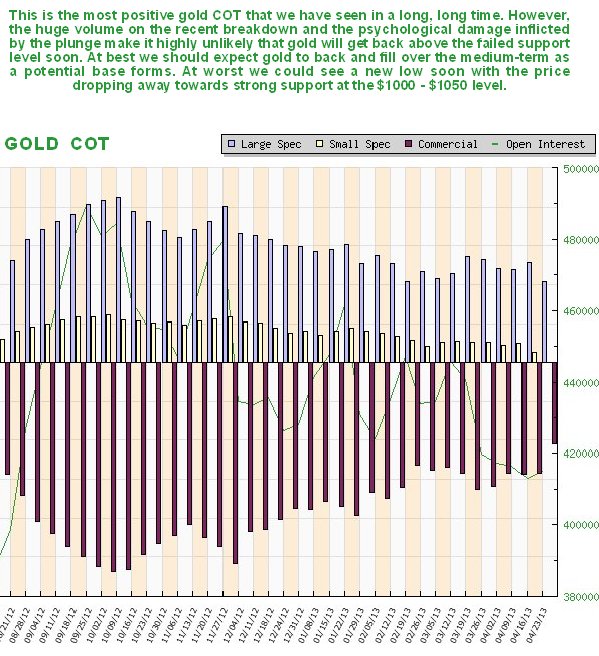
The latest COTs do look the most bullish for a long, long time, with Commercial short and Large Spec long positions dropping to their lowest levels for ages, with another substantial drop just last week. While this in itself does preclude further price declines - the Commercials could even wind up being long - it is a sign that a bottom is not too far away.
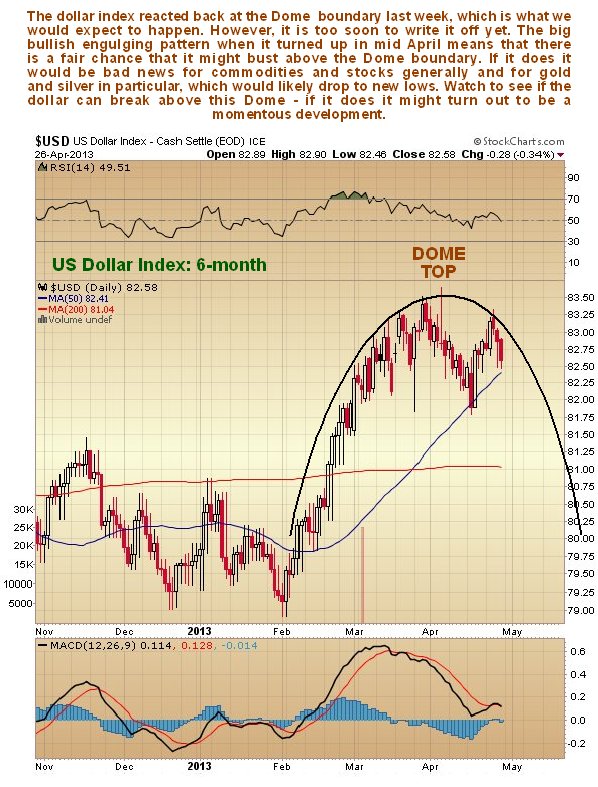
Although the dollar had little to do with gold's recent plunge, it is likely to have a major role to play in gold's future course, so we should always keep it in our sights. On the 6-month chart for the dollar index we can see how it rallied up to the boundary of a Distribution Dome and then backed off last week, which is normal action. Despite the name, Domes do not always result in reversal and a drop. While they are named appropriately as they are an indication of distribution, quite often a second upwave develops that breaks the price out of the top of the Dome to commence another upleg. This could happen here with the dollar, especially as a big bullish engulfing pattern occurred when the index reversed to the upside in mid-April. We need to be on the lookout for this, as such a breakout from this Dome would be bad news for commodities and stocks generally and for gold and silver in particular.
Two storylines have been doing the rounds since gold plunged, designed to keep bullish hopes alive. One is that the supposedly huge disconnect that exists between the paper and physical gold price is going to lead to a massive ramp in the price. If such a price differential did exist, then Big Money would arbitrage it away. The other is that as gold is going to $10,000 or $50,000 eventually, you should not therefore be upset if the price drops a mere 30% over the short to medium-term, as you are 'in it for the long haul' or 'in it to win it' etc. We try to keep 'one foot on the ground' and avoid Alice in Wonderland type fantasizing - sure gold could go to $50,000 if there is hyperinflation, but this is still some way off even if it's brewing and there is not a deflationary implosion first, and anyway it not such a big deal when it takes a wheelbarrow full of banknotes to buy a loaf of bread. If it's hope you want, nip down to the local store and buy yourself a lottery ticket, it's a lot cheaper.
By Clive Maund
CliveMaund.com
For billing & subscription questions: subscriptions@clivemaund.com
© 2013 Clive Maund - The above represents the opinion and analysis of Mr. Maund, based on data available to him, at the time of writing. Mr. Maunds opinions are his own, and are not a recommendation or an offer to buy or sell securities. No responsibility can be accepted for losses that may result as a consequence of trading on the basis of this analysis.
Mr. Maund is an independent analyst who receives no compensation of any kind from any groups, individuals or corporations mentioned in his reports. As trading and investing in any financial markets may involve serious risk of loss, Mr. Maund recommends that you consult with a qualified investment advisor, one licensed by appropriate regulatory agencies in your legal jurisdiction and do your own due diligence and research when making any kind of a transaction with financial ramifications.
Clive Maund Archive |
© 2005-2022 http://www.MarketOracle.co.uk - The Market Oracle is a FREE Daily Financial Markets Analysis & Forecasting online publication.