Silver Price Breakdown on Heavy Volume Does Not Look Good
Commodities / Gold and Silver 2013 Apr 28, 2013 - 06:11 PM GMTBy: Clive_Maund
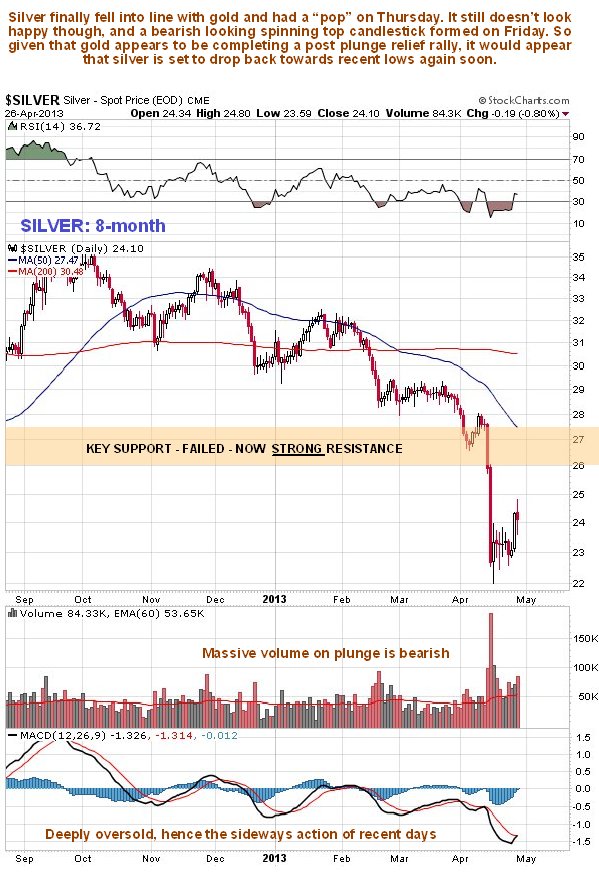
 After being stuck in a tight range following its plunge about 9 trading days ago, silver finally responded to gold's creeping advance and 'popped' on Thursday, but it was not that impressive and was followed by a rather negative 'spinning top' candlestick on Friday, meaning that it could have been a 1-day wonder especially given that gold's relief rally looks to be about done.
We can see recent action in detail on the 8-month chart below. On this chart we see that once silver crashed key support at and above $26 it plunged on very heavy turnover, which was bearish. The current minor relief rally is serving to unwind the oversold condition and thus creating the conditions for renewed decline. This rally is unlikely to get far and may be done already. With the earlier strong support so clearly and sharply defined, any attempt to get above $26 will meet with heavy selling from the wall of overhanging supply above that level arising from trapped traders who bought at higher levels.

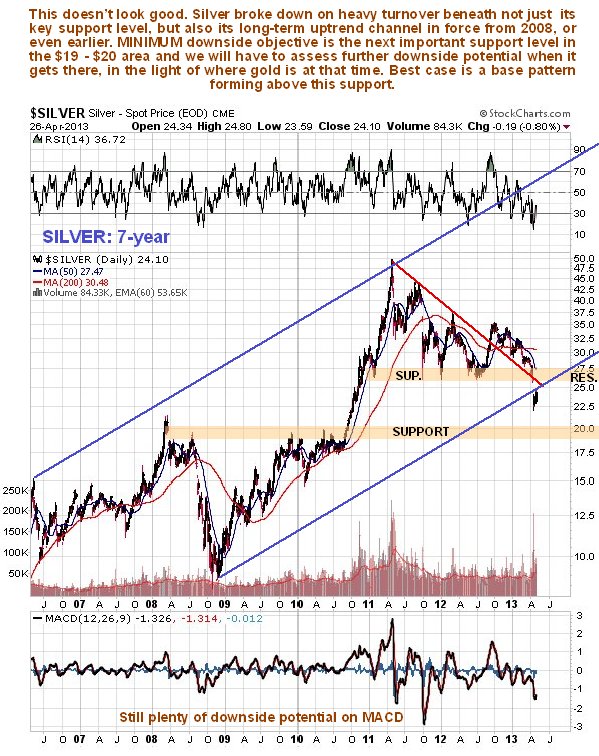
On the 7-year chart we can see that, as is the case with gold, silver not only broke below a key support level, but it simultaneously broke down from the long-term uptrend in force from 2008, or 2006 if you use its top line, opening up the risk of a more serious decline, with the first downside target being the quite strong support shown in the $19 - $20 zone. It is not so oversold as gold and so it has plenty of leeway to drop down to this level.

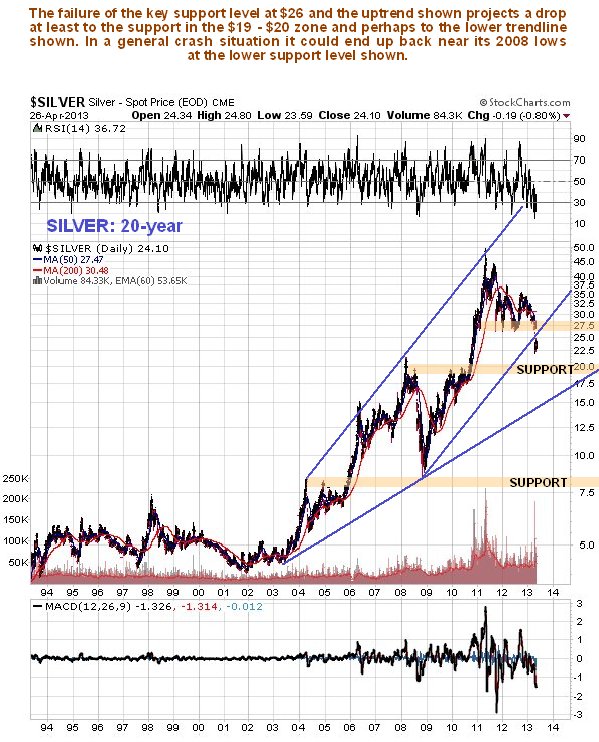
On its 20-year chart we can see that having crashed important support and broken down from the steeper uptrend, silver looks set to drop at least to the quite strong support in the $19 - $20 area, and in the event that gold breaks down from the long-term uptrend shown on its 20-year chart, which it is now perched some way above, and heads for the $1000 - $1050 area, then silver is likely to dig deeper into the broad band of support and continue on down towards the lower trendline shown on this chart, currently at about $16.

Although silver's price charts look discouraging, its COT chart is at it most positive in recent memory, with Small Spec long positions being now almost non-existent and Commercial short positions being at a relatively very low level. By itself this suggests that a bottom is not too far away, and what may happen over the short to medium-term is that a base pattern forms between the current price and the support in the $19 - $20 area. We should keep in mind that in the event of the silver price falling further, the Commercials' positions could even shift into net long territory for the first time in years.
By Clive Maund
CliveMaund.com
For billing & subscription questions: subscriptions@clivemaund.com
© 2013 Clive Maund - The above represents the opinion and analysis of Mr. Maund, based on data available to him, at the time of writing. Mr. Maunds opinions are his own, and are not a recommendation or an offer to buy or sell securities. No responsibility can be accepted for losses that may result as a consequence of trading on the basis of this analysis.
Mr. Maund is an independent analyst who receives no compensation of any kind from any groups, individuals or corporations mentioned in his reports. As trading and investing in any financial markets may involve serious risk of loss, Mr. Maund recommends that you consult with a qualified investment advisor, one licensed by appropriate regulatory agencies in your legal jurisdiction and do your own due diligence and research when making any kind of a transaction with financial ramifications.
Clive Maund Archive |
© 2005-2022 http://www.MarketOracle.co.uk - The Market Oracle is a FREE Daily Financial Markets Analysis & Forecasting online publication.


