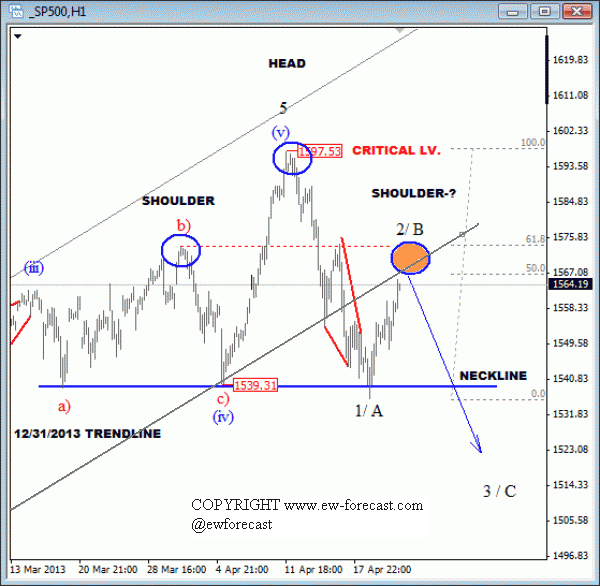
S&P 500 Showing a Top Formation At 1597
Stock-Markets / Stock Markets 2013 Apr 23, 2013 - 04:38 PM GMTBy: ForexPros
The S&P500 fell sharply last week from 1597, finding support around 1536 from where we have seen 20 point rally on Friday. Notice that market reversed from swing lows made in early April that caused a recovery towards the 1565/1575 Fibonacci resistance area. We believe that this pull-back represents a wave 2/B, as we labeled a decline from 1597 as a leading diagonal in wave 1/A.
Traders need to be aware of a new sell-off on this market into wave 3/C through 1530 area. A broken trend-line connected from December 31 can also become a nice resistance in wave 2/B around 1565. We also expect to see a top formation of a right shoulder of a bearish H&S pattern at the same zone. Meanwhile, invalidation level remains at 1597, so as long this level holds we will look lower.

Analysis by: http://www.Forexpros.com - Written by Gregor Horvat Forexpros
Forexpros offers the most definitive Forex portal on the web. It contains industry leading market analysis, up-to-the minute news and advanced trading tools which provides brokers, traders and everyone involved in the financial market with an all-round guide to Forex.
Copyright © 2013 by ForexPros.com All rights reserved.
Disclaimer: Trading Futures and Options on Futures and Cash Forex transactions involves substantial risk of loss and may not be suitable for all investors. You should carefully consider whether trading is suitable for you in light of your circumstances, knowledge, and financial resources. You may lose all or more of your initial investment. Opinions, market data, and recommendations are subject to change at any time.
© 2005-2022 http://www.MarketOracle.co.uk - The Market Oracle is a FREE Daily Financial Markets Analysis & Forecasting online publication.


