Global “Oil Shock” Rattles World Stock Markets
Commodities / Crude Oil Mar 13, 2008 - 06:34 PM GMTBy: Gary_Dorsch

 Cleaning up the mess that Mr Greenspan left behind was never going to be easy. Banks and brokers around the world face more than half-trillion dollars in write-offs as a consequence of the US sub-prime mortgage crisis, which is spreading from the US property market and roiling global stock markets. It's toppled the US economy into a recession and the tremors are also rattling Asian stock markets.
Roughly $7 trillion has been wiped from world stock markets since the beginning of the year amid fears of a severe US economic recession and financial institutions reporting more mega losses. “The market crisis will preoccupy us well into 2008,” he said German Finance Minister Peer Steinbrueck on Feb 15th. “The financial risks securitized by banks contained packaged explosives,” and he accused rating agencies of having a conflict of interest in the role they played in the process.
So far, the Bernanke Federal Reserve has pumped more than half-a-trillion dollars into the markets with open market operations and special emergency lending schemes, to help cushion the blow to the US economy and stock markets. However, there's evidence that the Fed's prescription for dealing with the sub-prime debt crisis, is actually making matters much worse, and leading to “Stagflation.”
As the Fed's rate cuts and massive money injections filter through the financial system, it weighs heavily on the US dollar, and in turn, a weaker dollar inflates huge bubbles in the global commodities markets. Fund managers have already poured an estimated $200 billion into commodities across the board, as a hedge against the explosive growth of the world's money supply, competitive currency devaluations, and the negative interest rates engineered by central banks.
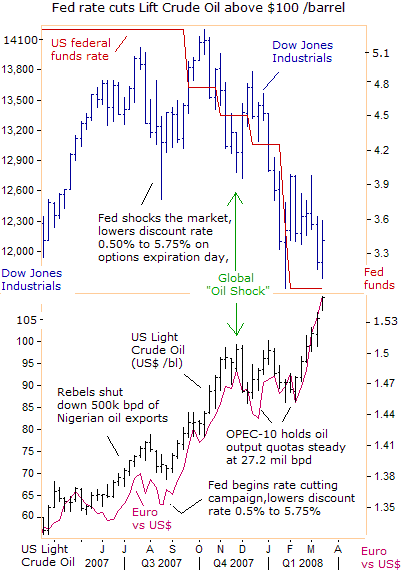
The price of crude oil was trading near $70 a barrel as recently as last August, when the Fed suddenly jolted the markets, by lowering its discount rate to 5.75% on Aug 17th, timed to squeeze short sellers in the stock market, on options expiration day. The Fed's abrupt shift towards easy money fueled a 1,500-point rally for the Dow Jones Industrials over the next two months to a record high of 14,100.
But the stock market's “irrational exuberance” didn't last long, once the unintended consequences of the Fed's rate cuts, a - Global “Oil Shock” – began to settle in. In trying to rescue the Dow Jones Industrials from the claws of a grizzly bear market, the Fed has sacrificed the US dollar, and in turn, ignited a powerful surge in the price of crude oil to $110 /barrel. And most US recessions in the post-World War II era were preceded by sudden spikes in oil prices.
On Feb 15th, Fed chief Ben Bernanke played down the threat of spiraling energy and food prices, saying “inflation expectations remain reasonably well anchored,” then signaled another rate cut in March, as an “insurance policy to head off an economic recession.” Since then, the price of crude oil has surged $17 /barrel, and is wrecking havoc on Wall Street and other major stock markets around the globe.
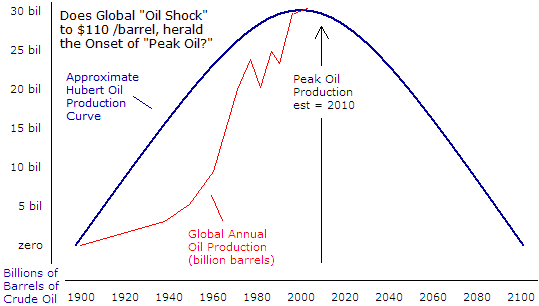
Global investors are plowing money into crude oil, because the longer-term fundamentals are bullish. The International Energy Agency is predicting that global oil demand will rise 2% this year to a record 87.5 million barrels per day. And a growing number of oil investors subscribe to the “Peak Oil” theory that holds to the belief that the global oil supply has already maxed out at 85 million per day.
The “Peak Oil” theory refers to the inevitability of a peak in global oil production. Oil is a finite, non-renewable resource, and once half of the original reserves are depleted, oil production is likely to stop growing and then begin a terminal decline. Of the 65 largest oil producing countries in the world, 54 are past their “Peak Oil” production and are now in decline, including the USA, down 11% since 1971, and the UK's North Sea down 27% since peaking in 1999.
Other big oil producers in decline include Australia, down 26% since 2001, and Norway, down 13% since 2001. The Cantarell oil field, Mexico's largest has also peaked with its output falling to 1.7 million bpd in 2007, down from its peak output of 2.1 million bpd. Thus, global oil demand is expected to exceed supply in the second half of this year, and the oil deficit will only grow wider in 2009, unless the global economy sinks into a sharp recession
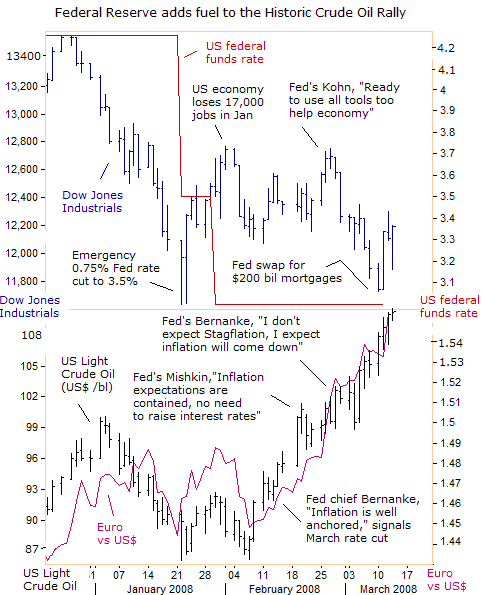
It's increasingly obvious that the Fed is targeting the stock market, and is trying to put an artificial floor under the Dow Jones Industrials at the 11,650 level, similar to central bank intervention in the foreign exchange market. “We have the tools,” said Fed deputy Donald Kohn on Feb 26th. “As Chairman Bernanke often emphasizes, we will do what is needed, to respond to difficult times,” he said.
But former US Treasury secretary Robert Rubin was once asked by his boss Bill Clinton, if he could be re-incarnated, what would he like to be? Rubin replied, “The bond market, because it controls everything.” Nowadays, the “bond vigilantes” are asleep in a coma, and unlikely to be resurrected anytime soon. Emerging in their place however, are the “crude oil vigilantes” who jack up the price of “black gold,” whenever the Bernanke Fed turns up the printing presses.
Thus, attempts by the Bernanke Fed to jig up the stock market with a money injections, are short-circuited, by the “crude oil vigilantes”. And the OPEC cartel recognizes the Fed's sleight of hand, and wants to be compensated for a weaker US dollar, with higher oil prices. “The oil market will stay above $100 during the current financial year,” said OPEC chief Chakib Khelil on March 10th. “The factors driving the market include speculation, geopolitical tensions, particularly the Iranian nuclear affair, and the crisis between Venezuela and Exxon-Mobil,” he said. However, “oil prices could retreat in 2009 with a recovery of the US dollar in foreign exchange markets and the election of a new US president.”
Shanghai Red-chips Rattled by “Peak Oil”
China emerged as an economic superpower amid the fastest industrial revolution the world has ever seen. China's economy has grown at 10% or more a year since the 1990's, and is expected to surpass Germany to become the world's biggest exporter, after sales of $1.2 trillion abroad in 2007, and reaping a staggering $262 billion trade surplus. China alone contributed 20% of the world's economic growth last year.
It only took the Shanghai red-chips slightly more than 2-years to gain 500% from below 1,000 in June 2005 to above 6,000, while the Nasdaq bubble returned 240% in less than two years to reach the record of 5,000 in March 2000. The Shanghai index reached a P/E ratio of 68, identical to the Nasdaq's P/E right before the tech-bubble burst. The combined market capitalization of the Shenzen and Shanghai exchanges hit a high of $3 trillion dollars, or 115% of China's $2.6 trillion GDP.
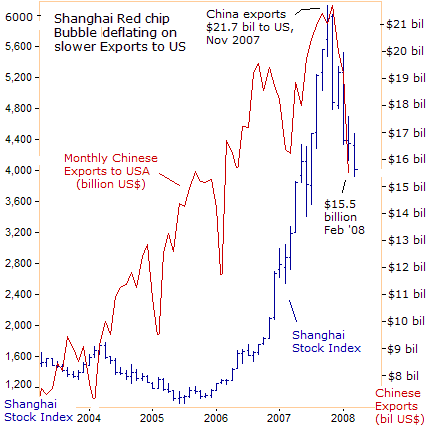
Chinese exports to the US have been a key driver behind the highly volatile Shanghai red-chip market. Exports to the US peaked at a record $21.7 billion last November, but then tumbled to $15.5 billion in February. Chinese exports typically fall sharply in February, during the New Year holiday, when factories close for at least two weeks. But for the first time this decade, Chinese exports to the US were 5% lower on a year-over-year basis, indicating that an economic recession in the United States is beginning to chip away at demand for Chinese exports.
But China's Achilles heel is its voracious appetite for oil. China accounted for half the rise in global oil use this decade. Its industrial revolution led by construction and manufacturing, is highly energy-intensive, and a major reason why crude oil is above $100 a barrel. But with crude oil and other commodity prices spiraling higher, its mammoth trade surplus is narrowing, exporter profit margins are shrinking, and China's economic output is descending into single digits.
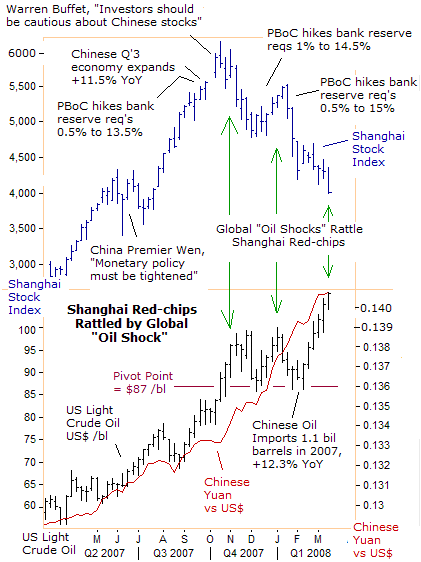
China ranks as the world's #2 oil consumer after the US, and demand is expected to grow 500,000 bpd annually in coming years, driven by industrial growth and consumer demand as incomes rise. China imported 1.1 billion barrels in 2007, up 12.3% from the previous year. China supplied its fuel needs for decades from domestic fields but rising demand made the country a net importer in the late 1990's. Imports now account for 50% of consumption.
India and China are two Asian giants that consume only a third as much oil as the US today. But if the Chinese and Indians consumed as much oil per capita as Americans do, the world's oil demand would be closer to 200 million bpd, instead of 85 million barrels today. And with the world running on a limited cushion of Saudi spare capacity, any interruption in supplies from Mexico, Nigeria, or hurricanes and talk of armed conflict with Iran, causes oil prices to spike higher.
By Gary Dorsch,
Editor, Global Money Trends newsletter
http://www.sirchartsalot.com
To stay on top of volatile markets, subscribe to the Global Money Trends newsletter today, which includes a special bonus for new subscribers, - “Audio Broadcasts”, posted on Monday and Wednesday evenings, during Asian trading hours, to the Log-In section of our website. This article was just the Tip of the Iceberg , of what's inside the Global Money Trends newsletter, published on Friday afternoon. Here's what you will receive with a subscription,
Insightful analysis and predictions of the (1) top dozen stock markets around the world, Exchange Traded Funds, and US home-builder indexes (2) Commodities such as crude oil, copper, gold, silver, the DJ Commodity Index, and gold mining and oil company indexes (3) Foreign currencies such as, the Australian dollar, British pound, Euro, Japanese yen, and Canadian dollar (4) Libor interest rates, global bond markets and central bank monetary policies, (5) Central banker "Jawboning" and Intervention techniques that move markets.
GMT filters important news and information into (1) bullet-point, easy to understand analysis, (2) featuring "Inter-Market Technical Analysis" that visually displays the dynamic inter-relationships between foreign currencies, commodities, interest rates and the stock markets from a dozen key countries around the world. Also included are (3) charts of key economic statistics of foreign countries that move markets.
Subscribers can also listen to bi-weekly Audio Broadcasts , with the latest news and analysis on global markets, and view our updated model portfolio for Q'1, 2008. To order a subscription to Global Money Trends , click on the hyperlink below,
http://www.sirchartsalot.com/newsletters.php
Mr Dorsch worked on the trading floor of the Chicago Mercantile Exchange for nine years as the chief Financial Futures Analyst for three clearing firms, Oppenheimer Rouse Futures Inc, GH Miller and Company, and a commodity fund at the LNS Financial Group.
As a transactional broker for Charles Schwab's Global Investment Services department, Mr Dorsch handled thousands of customer trades in 45 stock exchanges around the world, including Australia, Canada, Japan, Hong Kong, the Euro zone, London, Toronto, South Africa, Mexico, and New Zealand, and Canadian oil trusts, ADR's and Exchange Traded Funds.
He wrote a weekly newsletter from 2000 thru September 2005 called, "Foreign Currency Trends" for Charles Schwab's Global Investment department, featuring inter-market technical analysis, to understand the dynamic inter-relationships between the foreign exchange, global bond and stock markets, and key industrial commodities.
Copyright © 2005-2008 SirChartsAlot, Inc. All rights reserved.
Disclaimer: SirChartsAlot.com's analysis and insights are based upon data gathered by it from various sources believed to be reliable, complete and accurate. However, no guarantee is made by SirChartsAlot.com as to the reliability, completeness and accuracy of the data so analyzed. SirChartsAlot.com is in the business of gathering information, analyzing it and disseminating the analysis for informational and educational purposes only. SirChartsAlot.com attempts to analyze trends, not make recommendations. All statements and expressions are the opinion of SirChartsAlot.com and are not meant to be investment advice or solicitation or recommendation to establish market positions. Our opinions are subject to change without notice. SirChartsAlot.com strongly advises readers to conduct thorough research relevant to decisions and verify facts from various independent sources.
Gary Dorsch Archive |
© 2005-2022 http://www.MarketOracle.co.uk - The Market Oracle is a FREE Daily Financial Markets Analysis & Forecasting online publication.


