


Uranium Stocks Trend Remains Bearish Despite Recent Rally
Commodities / Uranium Mar 13, 2008 - 12:32 AM GMTBy: Merv_Burak
 Another up day but nothing to celebrate. The Merv's Daily Uranium Index closed higher by 0.027 points or 0.82%. There were 27 winners, 19 losers and 4 unchanged. Of the top five based upon market value, Cameco gained 1.9%, Denison gained 5.9%, First Uranium was unchanged, Paladin gained 4.2% and Uranium One gained 4.9%. The best performer was Energy Fuels with a 24.1% gain while the worst performer was Aurora Energy with a loss of 8.8%.
I thought I'd show the intermediate term P&F chart as I haven't shown it for some time. The simple thing to understand, my criteria for trend reversal is that the price must break below (or above) its up trend line (or down trend line) AND must break below (or above) two previous lows (or highs) for a trend reversal from bullish to bearish (or bearish to bullish).
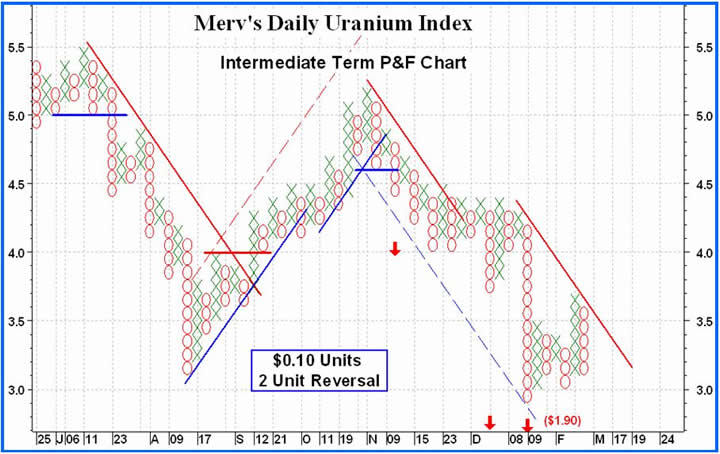
From this criteria we had a P&F bear market on the break below $5.00 that lasted until a P&F bull market was confirmed at $4.20. That was followed by another bear market on a break at $4.60 and we are still in that bear.
The primary support (blue) and resistance (red) lines are drawn in solid while secondary lines are drawn dashed.
The bull market break at the $4.10 level projected to $5.20 (using an horizontal count method), which was met. The bear market break at $4.60 projected to $4.00, which was met. The subsequent consolidation and new bear move at $4.00 projected to $2.70. Another subsequent break at $3.70 projects to $1.90. The following action gave us another projection using an alternate (vertical count) method to the $1.90 level as a confirmation.
So, from the intermediate term P&F we have as a next projection the $2.70 level and a far out one to $1.90. With the latest action the $2.70 projection does not look that out of line but the $1.90 projection looks like it may just be too far away to be met (but who knows). Sooner or later the trend reverses and leaves the final projections sitting in the dust. That could be the $1.90 one, but maybe the $2.70 one yet.
Back to normal reality. The intermediate term continues as it has for many weeks. The Index trades below its negative sloping moving average and the momentum indicator continues inside its negative zone, still below its negative sloping trigger line. What else can I say, the intermediate term rating remains BEARISH .
The same story goes for the short term, Index below its negative moving average line and the momentum inside its negative zone still below its negative sloping trigger line. The two, momentum and its trigger line, are closing on each other and may possibly cross within a day but it will still be the slope of the trigger line that will count. The aggressive Stochastic Oscillator (SO) usually moves quite quickly during a change in trend. However, in this case the SO is moving higher and has moved through its oversold line to the up side BUT the move is very lethargic. One gets the impression that if the SO could talk it would be saying “not impressed at all with this latest move”. All in all, the short term rating remains BEARISH.
By Merv Burak, CMT
Hudson Aero/Systems Inc.
Technical Information Group
for Technically Uranium with Merv
Web: http://techuranium.blogspot.com/
e-mail: merv@themarkettraders.com
During the day Merv practices his engineering profession as a Consulting Aerospace Engineer. Once the sun goes down and night descends upon the earth Merv dons his other hat as a Chartered Market Technician ( CMT ) and tries to decipher what's going on in the securities markets. As an underground surveyor in the gold mines of Canada 's Northwest Territories in his youth, Merv has a soft spot for the gold industry and has developed several Gold Indices reflecting different aspects of the industry. As a basically lazy individual Merv's driving focus is to KEEP IT SIMPLE .
This Blog is - A periodic review of the daily or weekly market action in uranium stocks. The review is strictly from the technical perspective. Merv is a pure market technician. Weekly, one will find a table of technical information and ratings of the 50 component stocks of the Merv's Uranium Index as well as a weekly summary of the uranium stock activity. Daily (most days), one will find a daily review of the market action of the Merv's Daily Uranium Index as well as technical analysis of one or more uranium stocks of interest.
Disclaimer - Technical analysis is not perfect. Should you expect perfection this is not the site for you.
Technical analysis IS a very sound technique to assess the daily or weekly trading activities in securities and to assess appropriate timing of investment activities. This blog provides such technical analysis of the trading activity in uranium stocks for your information. Any use made of this information is strictly at the users risk. No guarantees are made for the accuracy or potential for the information provided herein. Use at your own risk. You are strongly advised to check with your broker or investment adviser before activating any investment desisions.
Merv Burak Archive |
© 2005-2022 http://www.MarketOracle.co.uk - The Market Oracle is a FREE Daily Financial Markets Analysis & Forecasting online publication.