


Why Bank Bail in and Bail out Wont Work. Case study Iceland and Greece
Stock-Markets / Credit Crisis 2013 Apr 11, 2013 - 09:41 AM GMTBy: Sam_Chee_Kong

 As most of us can remember that Iceland was the first country that went down during the last Global Financial Crisis in 2008. During that time Iceland had done something remarkable and that is during the five years prior to the crisis, managed to transform its economy from a fishing industry to a mega hedge fund country. Many of its citizens left their traditional trade which is fishing to become fund managers and salesman. As a result Iceland’s banking assets (physical assets + Loans + Reserves + Investment securities) grown to more than 10x its GDP of $14 billion. With such high leverage, when the financial crisis struck it is unable to defend its economy and hence its house of cards collapsed.
The purpose of this article is a post-event analysis of the performance of the Icelandic economy that refuses a bailout as compared to Greece which went for a bailout with the injection of funds from Troika. To simplify matters, we shall coin the bail-in and bail-out as (BIBO) for short. Of course in the short term it helped stabilized the Greek economy for a while but we want to know to what extent it had transformed the Greek economy in the long run with the accompanying terms and conditions and austerity measures. In this article we shall compare the performance of both the economies of Iceland and Greece with the economic indicators or metrics below from the year 2002 to the present. We believed we have been fed with too much toxics by the mainstream medias which are also own by them that capitalized on the age old investment axiom of good-to-good.
Does Government do what’s right for us?
We have led to believed or should we say brought up with the perception that when someone does well then he/she will be blessed in return. Hence it gave rise to an old age investment axiom of good-to-good and bad-to-bad reaction which can be translate to good action leads to good reaction. So we always believed that whatever our Government does it will be for the better of us. So when they bailed out the banks, we believed that they are doing the right thing and we should leave everything in their good hands and expect good reaction. Right? WRONG ! We shall show you on our analysis below that whatever our Government does is not necessary the right thing to do. We have based our analysis on the following indicators or metrics.
- GDP per Capita
- Inflation rate
- Balance of Trade
- Government Debt to GDP
- Government 10Y bond
- Government Spending
- Consumer Spending
The following is a review of the Icelandic economy which not only refuses a bailout of its banks but instead bankrupting them. They are taking a big risk to take things into their own hands instead of letting the bankers running their country. They are going off the beaten path and from our analysis we reckoned that they have done the right thing. Below we compare the economies of two different countries that have taken different paths – one that receive bailouts (Greece) and the other (Iceland) refuses bailouts. The first metric we are using is the GDP per Capita.
- GDP Per Capita ratio
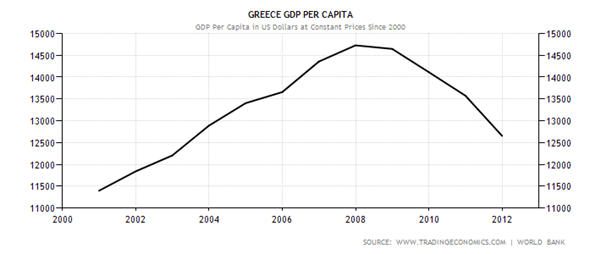
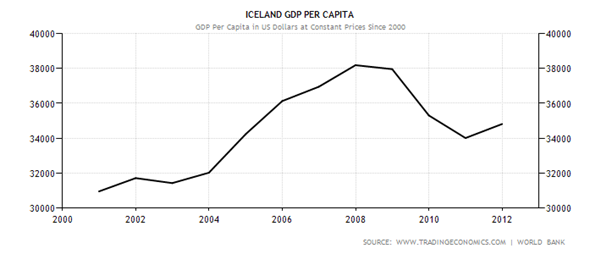
The first metric that we are going to compare is the GDP/Capita ratio. GDP/Capita also shows the standard of living of a particular country and a higher ratio normally denotes a higher standard of living. As you can see from the charts 1a & 1b below Greece seems still to be on the plunging mode and somehow there seems to be no slowing down in sight and hence a floor has yet to be set. Whereas Iceland seem to be going on a firmer footing when its GDP/Capita ratio seems to be stabilizing around 2011 and it seems to be on the uptrend. Iceland’s current (2012) ratio seems to be heading back towards the 2006 level whereas Greece’s is heading backwards to the 2003 level.
Chart 1a & 1b (GDP Per Capita)
- Inflation Rate
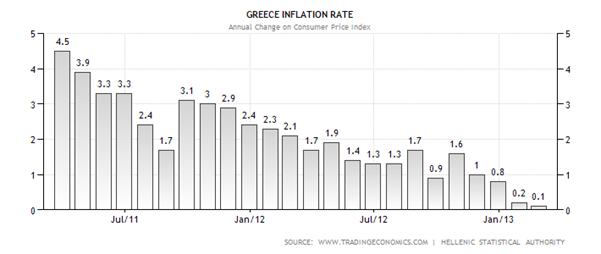
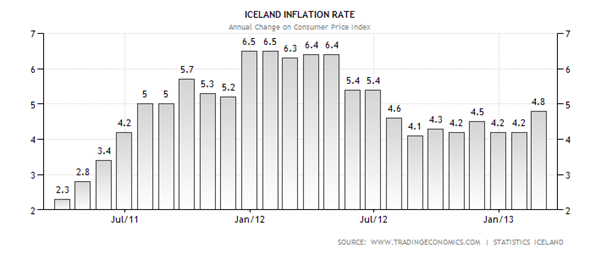
The second metric is the Inflation rate. From Chart 2a below it seems like Greece’s might be facing the risk of a deflationary spiral as happened to Japan in the 1990s. Its inflation rate has fallen from 4.5% in April 2011 to 0.1% in February 2013. Once the economy sets it path on a deflationary mode it is very difficult to reflate it back to the preferred long term inflation rate of 1-2 % above zero. Japan will be a good example when its economy was gripped by the deflationary forces since the 1990s, eventually it ended with 2 lost decades of growth. Only recently newly elected Prime Minister Mr Shinzo Abe is committed to reflate Japan’s economy at any cost. On the other hand Iceland’s inflation rate is now at 4.8% which is hovering around the mean of (4.7%) for the past three years and considered to be manageable and essential for economic growth.
Chart 2a & 2b (Inflation Rate)
- Balance of Trade
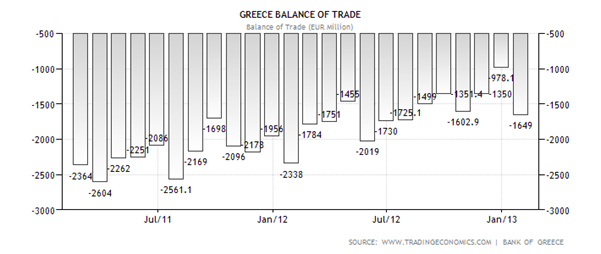
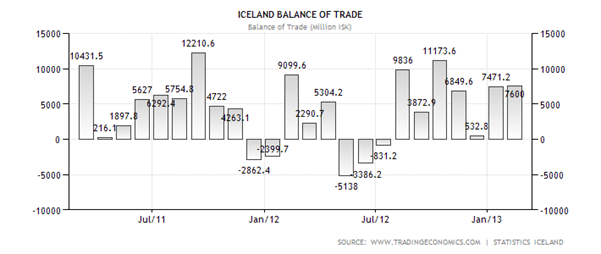
The third metric is the Balance of Trade which is also can be defined as difference between the exports and imports in monetary terms. From Chart 3a it is very obvious that Greece has been running trade deficits for the past 24 months consecutively. Negative trade deficits means there is a net outflow of money from Greece. This means that Greece may need to borrow more in future in order to finance its government expenditure and hence will incur more debts in its coffer. As for Iceland it is a different story where out of the 24 months 19 of them are experiencing positive balance of trade. Positive balance of trade means positive net inflow of funds and hence it enable the Icelandic government either quicken their repayment of debts or embark on new government fiscal expenditures without resorting to more borrowing.
Chart 3a & 3b (Balance of Trade)
- Government Debt/GDP
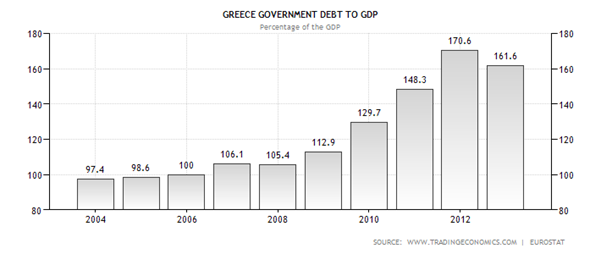
Next is the Government Debt/GDP ratio or the total amount a country has as in percentage of its GDP. It seems that Greece’s Debt/GDP ratio is currently way above 100% and as of end of 2012 it at 161.6%. A high Debt/GDP means more funds are needed for interest payments and hence less will be available for development. We will foresee this trend will extend much further into the future because 1) its ratio is still considered dangerously high and 2) many of its economic indicators are still recording negative readings and hence may dampen its ability to quicken its repayment schedule.
It should be of immediate concern for any government to bring down their debt ratio to below 100% and preferably in the long term to below 50% which is more manageable. If not it will risked being entangled into a ‘Debt Trap’ meaning more new money needed to borrow to cover the previous debts. When this goes on eventually a country will have to succumb to its debts burden and collapsed.
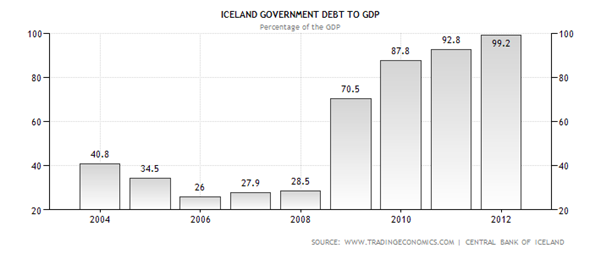
As for Iceland, although its ratio is at 99.2% which seems critical but at a close look at it looks like the ratio is hitting a plateau in the last three years. The debt growth seems to be tapering off although there is a big jump since 2008. This can be explained by the increased in the borrowings after the crisis to finance its development costs.
Chart 4a & 4b (Government Debt to GDP)
- 10y Government Bond
Our next metric is the 10y Government Bonds. The yield on the Government Bonds reflects the expected inflation rate and also the ability of the issuing Government to repay its debts. The higher the expected risk the higher the yield will be demanded by investors. As of yesterday’s closing Greek Government 10Y bond, yield 12.79% which can be considered very high. That means that the Greek Government is paying more for its funds. As for Iceland its 10Y bond only yields 6.4% which means the Government can borrow at a lower interest rate because investors have more confidence in getting their money back.
Chart 5a & 5b (Government 10yr Bonds)
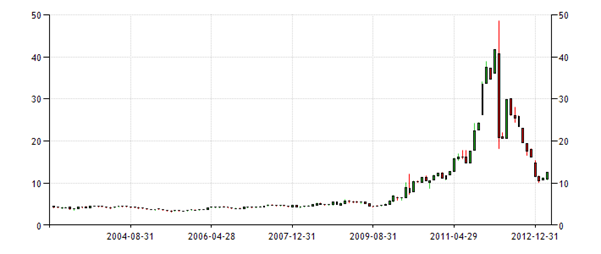
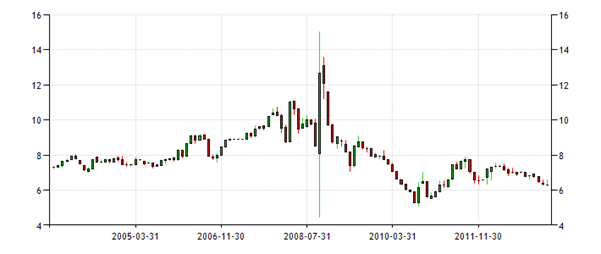
Source : Tradingeconomics.com
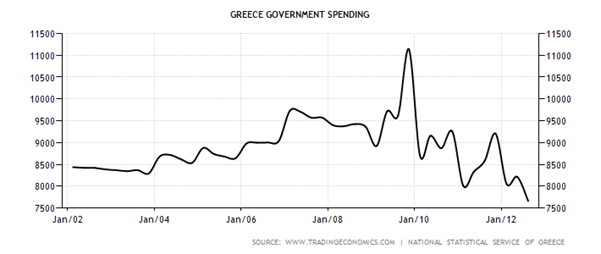
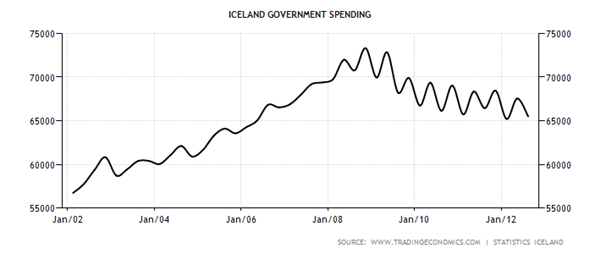
- Government Spending
The sixth indicator is the Government spending. This is the part where the Government spend on public services such as roads, bridges, schools, defence and other public projects for the betterment of its citizens. It seems like the Greek Government is doing the opposite. To reflate an economy its government will have to increase spending through its expansionary fiscal and monetary policies. Without the government taking the lead by increasing its spending so as to boost the confidence in the economy there is no way the private sector is going to initiate such a move.
As can be seen from the chart 6a below, there is a contraction in spending by the Greek government. By spending less, how can the Greek government instil economic growth and hence create jobs and help increase confidence among its consumers which eventually leads to increase spending. This also helps to explain why the inflation rate (prices) in the Greek economy kept falling. The Greeks will have no choice but to reflate its economy or else risk going into a deflation.
On the other hand Iceland seems to be stabilizing on its Government spending and thus able avoid any deflationary pressure on its economy in the future. A quick look revealed that the Greek government spending as of 2012 has fallen to less than it had in 2002.
Chart 6a & 6b (Government Spending)
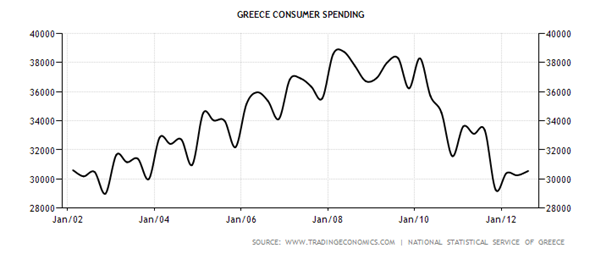
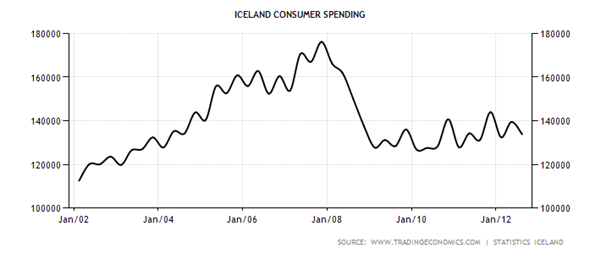
- Consumer Spending
Consumer spending is an important economic indicator because many economies depended on the consumption of their consumers to generate growth in their respective industries and hence the economy. As we have mentioned above without the Government taking the initial steps to increase spending, the private sector will not be motivated to do so. This is a classic case of ‘Paradox of Thrift’ meaning the more you save and the less money you spend the worse off will be the economy. This is because when everyone is cautious and not spending then how can this help to boost the economy. When economic activity is slowed so will be the velocity of money and thus there will be a limited multiplier effect on the economy.
As you can see from the charts below since 2008, Icelandic consumers have been increasing their spending since 2009 whereas Greek consumers spending only seem to be improving since last year. So it will not be a surprise if the Icelandic economy rebound much sooner and hence performed much better than the Greek economy in the coming years.
Chart 7a & 7b (Consumer Spending)
Why Bank Bail-ins and Bail-outs (BIBO) will not work?
Short answer:
It violated some tenets of market economy such as interfering with the free flow of capital and also the neglect of the consumer economy.
Long Answer :
In the ‘Wealth of Nations’, Adam Smith pointed out that,
“To increase the wealth of a nation, he argued that society should exploit the natural drives or propensity to bettering their conditions of the people. Government should not repress self-interested people, for self-interested people is a rich natural resource. People would be fools and nations will be impoverished if they depended on charity and altruism”.
He also states that under a market system, the free flow of goods, services and capital even the poor and politically impotent can survive. In a market economy there will be less government which also means more freedom and laissez-faire in the economy. In contrast under a centrally planned system political power determine economic position where only the friends of the kings and lords can grow rich. Or shall we say centrally planned system breeds corruption and cronyism.
According to him under the market system, the invisible hand through prices and profits will determine not only what and how much to produce but also what price to charge. High prices will lead to high profits and this will sound alarm bells to the competitors to start producing more of that product and eventually will drive prices down to point where only normal profits can be earned.
In other words there should be no intervention in the flow of goods, services and capital in a market economy for if the government starts interfering then it is a signal that it is moving towards a non-market or centrally planned economy. If the invisible hand fails to regulate the economy then there will either be shortages or over production (excesses) of goods produced. Firms that are unable to respond to such situations will be driven out of business. This is where Joseph Schumpeter’s ‘Creative Destruction’ will work its way into the economy. In Schumpeter’s creative destruction it is a case for survival of the fittest. Young innovative and efficient will replace old, inefficient and unproductive companies so that the economy can regenerates itself again to be more dynamic.
For the past decades the economies of the Western World has gradually transformed from a ‘Keynesian model to a Monetarist model’. Keynesians believed in using Government expenditure and taxes to encourage or discourage economic growth. In times of economic slowdown the government will increase spending and lower taxes and vice versa. On the contrary the Monetarists believed in the use of money supply to solve its economic problems. In times of economic downturn the money supply should be increased to encourage more spending in the economy and vice versa.
However for the past few years since the Global Financial Crisis in 2008, The Monetarist realized that the use of Quantitative Easing to increase the Money Supply to lift their economies from recession does not work. As a result The Monetarists in the Western world are now moving towards more government intervention in its allocation of goods, services and capital. The government decides not only on which companies are getting the bailouts and who are paying the taxes but also how much while at the same time neglecting the masses. As a result of this misallocation of resources shortages and excesses are appearing in areas that are not supposed to be.
This current mutation from a market to non-market economy will go on until its people starts asking : Who the hell is in charge of food production in this country? In a non-market economy the answer will be the government but in a market economy it is NOBODY. You may ask why? The answer lies with Adam Smith’s invisible hand that performs its magic behind the scenes. As an example, in bread production the consumer does not know the bakery owner, the bakery owner does not know the farmer and similarly the flour producer does not know the land owner. Prices and profits will help to decide on what type and how much of different type of bread to be produced.
Conclusion
In conclusion we would like to point out that agreeing to bail outs only provides a short term relief but not necessarily the right solution for fixing the economy in the long term. As can be seen from the above in the long term Greece will have to pay the price. We might be biased in a way by just comparing one country but if you look into the rest like Ireland, Portugal and Spain, they are still not out of the woods yet. Iceland had done some bold moves by refusing bailouts and hence bankrupting its banks. So it might be a precedent for other countries to follow if it works.
Finally the following are the credit ratings of Greece and Iceland from various credit rating agencies.
Ratings Agency |
Iceland |
Greece |
Standard & Poor |
BBB- |
B- |
Moodys |
Baa3 |
C |
Fitch's Rating |
BBB- |
CCC |
Source : Trading Economics
From the above, needless to say whether Greece or Iceland has made the right decision. The result speaks for itself.
by Sam Chee Kong
cheekongsam@yahoo.com
© 2013 Copyright Sam Chee Kong - All Rights Reserved
Disclaimer: The above is a matter of opinion provided for general information purposes only and is not intended as investment advice. Information and analysis above are derived from sources and utilising methods believed to be reliable, but we cannot accept responsibility for any losses you may incur as a result of this analysis. Individuals should consult with their personal financial advisors.
© 2005-2022 http://www.MarketOracle.co.uk - The Market Oracle is a FREE Daily Financial Markets Analysis & Forecasting online publication.