


Taking Economic and Market Statistics and Data Distortion at Face Value
Stock-Markets / Financial Markets 2013 Apr 10, 2013 - 09:42 AM GMTBy: John_Mauldin

 Last Friday I was in Sonoma, California, for Mike Shedlock’s investment conference. The weather was grey and gloomy, but the conversation was animated and bright. I was fully engaged the whole day and never more than when John Hussman was speaking, commenting, or asking tough questions. John and I have talked on the phone and corresponded for years but had never met. What a consummate gentleman and scholar. We felt like we had been old friends for years and committed to finding opportunities in the future to get together and compare notes in person.
John is no stranger to long-time readers of Outside the Box, as he has probably been the source of more OTBs than any other writer. John and I share a common foe that focuses our attention: a weekly deadline that we sometimes battle long into the night. This week John shares with us some of the insights he presented in Sonoma. One quick quote that I bet will spark your interest:
On the earnings front, my concern continues to be that investors don’t seem to recognize that profit margins are more than 70% above their historical norms, nor the extent to which this surplus is the direct result of a historic (and unsustainable) deficit in the sum of government and household savings. As a result, investors seem oblivious to the likelihood of earnings disappointments, not only in coming quarters but in the next several years. We continue to expect this disappointment to amount to a contraction in earnings over the next 4 years at a rate of roughly 12% annually.
Corporate profits are nothing if not mean-reverting. There are several explanations for this phenomenon; but whatever the cause, the current off-the-charts percentage of profits to GDP is highly unlikely to become an enduring feature of the New Normal. Especially not given the recent weakness across the rest of the data spectrum.
John manages the eponymous Hussman Funds, and you can learn more and read his additional work at www.hussmanfunds.com.
I am in the air, on my way to New York City at the moment, where I will enjoy a few dinners and two days of meetings and media before returning to Dallas. Tonight, Barry Ritholtz has called a dinner summit, and I notice that Maine fishing buddies Scott Frew and Jim Bianco are on the guest list. One of the topics, I am sure, will be the unintended consequences of central bank policy. I get what Japan, Europe, and the US want to try to achieve. But what uninvited and unwelcome guests will disrupt their efforts? We are in totally uncharted waters, with no historical precedent of QE on such a massive and global scale. And our political leaders, in Europe and elsewhere, pick this moment to screw around with the trust that depositors place in their banks? Is this really any way to run a railroad, barreling full speed down the track when there has been no slow-motion testing done? No stress tests on the bridges?
Do the politicians and central bankers actually think they can fully model the ramifications of their present actions? And if so, what model are they using? I get worried that they may be using a two- or three-level, variable-input model, when there may actually be a dozen or more major interconnecting nodes. Which is all the more reason to respect Hussman’s nervousness.
But tonight I will enjoy my dinner and friends. We have to take life’s pleasures as they come to us, and I am grateful that I get more than my share of such opportunities. I have to add, though, that looking over the latest analysis of the health insurance costs for my small company and family has certainly soured my stomach. Ouch. Good thing inflation is only 2%, right? If I couldn’t trust that government-derived number, I think healthcare cost increases might worry me.
But let’s all have a great week!
Your can’t afford to get sick analyst,
John Mauldin, Editor
Outside the Box
JohnMauldin@2000wave.com
Taking Distortion at Face Value
By John P. Hussman, Ph.D.
March U.S. Non-Farm Payrolls +88,000 (payroll survey, median expectation was 175,000)
March U.S. Civilian Employment -206,000 (household survey)
March Canadian Employment -54,500 (worst print in 4 years)
March German Unemployment +13,000 (surprise increase)
Companies issuing negative earnings preannouncements for Q1 2013: 78% (h/t Josh Brown)
One of the striking features of the recent market advance has been the nearly triumphant confidence that there is zero risk of a U.S. economic recession. Back in January, I observed:
The economic data are wrestling between two likely possibilities and a third less likely one. The first of the likely ones remains that the U.S. already entered a recession in the third quarter of 2012. While I expect the full third-quarter GDP figure of 3.1% to remain positive post-revision, it’s not at all clear that fourth-quarter GDP (estimated to come in about 1.5%) will survive those eventual revisions – ditto for the marginal bounce in industrial production. The second likely possibility is that the enthusiasm about QEternity (combined with a positive jolt to personal income from special dividends to front-run the fiscal cliff) represented another successful round of “kick-the-can” to push a weak economy from the verge of recession for another few months. When we look at the broad evidence from a variety of good leading and coincident indicators, that’s actually the possibility that I am starting to lean toward. The unlikely possi bility, in my view, is that the economy has started to walk on its own. (see Puppet Show)
With a few months of additional data in hand, the evidence further supports the "kick-the-can" interpretation. Specifically, enthusiasm about QEternity, coupled with a positive jolt to personal income from special dividends, can probably be credited for another successful round of “kick-the-can,” pushing a weak economy from the verge of recession for another few months, but not durably so.
My impression is that we have once again arrived back at that can. While there is no shortage of smug observers who believe that recession risk does not exist and never did, the fact is that the strongest leading indicators, as well as the most timely coincident data, have deteriorated and danced along the border between economic expansion and economic recession for more than two years. Meanwhile, repeated rounds of QE have produced little but short-lived bounces to defer a recession that historically would have followed such deterioration more quickly. The chart below offers a good picture of this process.
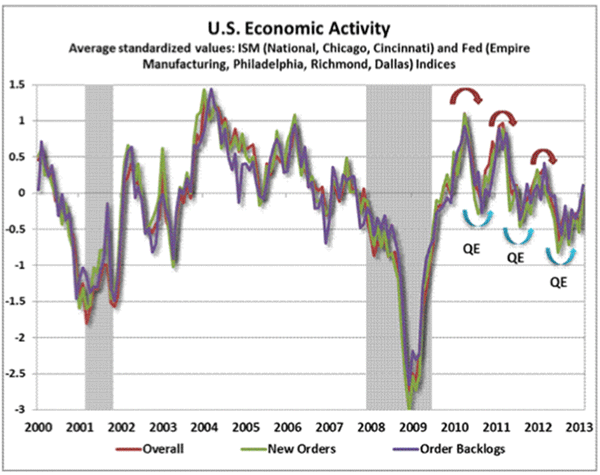
Notice the successively lower levels, as each round of quantitative easing has smaller and smaller effects on real economic activity (speculative activity in the financial markets aside). The question at present is whether the recent bounce will prove to be temporary as well. This expectation is certainly consistent with the series of rapid-fire misses from the Chicago Purchasing Managers Index (particularly the new orders component), the national PMI reports for both manufacturing and services, and the unexpected weakness on both payroll and household employment surveys.
For my part, I continue to expect the U.S. economy to join a global recession that is already in progress in much of the developed world (assuming a U.S. recession has not already started, which we can’t rule out, but would require knowledge of eventual data revisions to confirm). Suffice it to say that the realistic case for a sustained economic expansion here remains terribly thin.
While some observers will reflexively point to the housing market as a sign of economic recovery, it is important to recognize that the millions of homeowners with underwater mortgages (home values below the amount of mortgage debt still owed) have no ability to sell their homes even if they wish to do so, unless they can come up with the difference out of pocket. As a result, the natural flow of demand from new household formation must be satisfied from an inventory of homes for sale that is much smaller than the actual “shadow inventory” that would be available if losses did not have to be taken in order to sell those homes. So the demand for homes resulting from household formation is satisfied from limited inventory plus new home building, even though there is an ocean of distressed and unsold homes already in existence. From this perspective, it should be clear that the bounce we’ve seen in housing is not a sign of economic recovery, but is ins tead a sign of misallocation of capital due to what economists would generally call a “market failure.”
Taking Distortion at Face Value
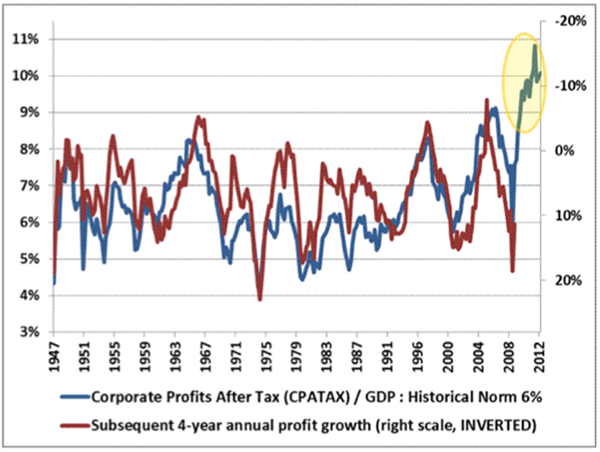
On the earnings front, my concern continues to be that investors don’t seem to recognize that profit margins are more than 70% above their historical norms, nor the extent to which this surplus is the direct result of a historic (and unsustainable) deficit in the sum of government and household savings (see Two Myths and A Legend for an analysis, including more than a half-century of data on this). As a result, investors seem oblivious to the likelihood of earnings disappointments not only in coming quarters, but in the next several years. We continue to expect this disappointment to amount to a contraction in earnings over the next 4 years at a rate of roughly 12% annually.
Despite the enormous weight of both accounting identity, historical data, and simple arithmetic, we continue to encounter persistent hostility to the idea that profit margins are the mirror image of extraordinary and unsustainable deficits in the government and household sector. The actual relationship was first detailed by the economist Michal Kalecki in the mid-1900’s. James Montier of GMO gives a nice derivation. The full relationship is:
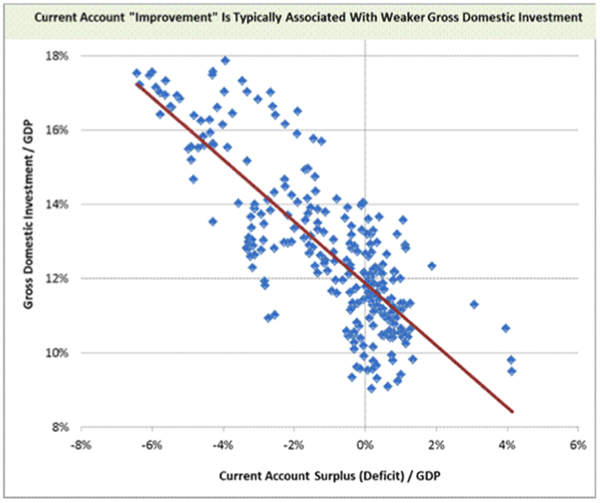
Profits = Investment – Household Savings – Government Savings – Foreign Savings + Dividends
As I noted over a year ago, dividends exhibit very little volatility over time, and do not exert a material amount of volatility in the above relationship over the course of the economic cycle. It also happens that particularly in U.S. data, the difference between Investment and Foreign Savings (i.e. the inverse of the current account deficit) also fluctuates relatively little, because current account “improvement” is typically associated with deterioration in gross domestic investment, as shown below in data since the 1940's.
As a result, the Kalecki equation reduces, for all practical purposes, to a statement that corporate profits move opposite to the sum of household and government saving. Again, see Two Myths and A Legend. More than a half-century of data that demonstrates the tightness of this relationship.
The upshot is very simple, the U.S. stock market presently reflects two unstable features. One is that extraordinary monetary policy – specifically quantitative easing – has created an ocean of zero-interest money that someone has to hold at each point in time, and that provokes a speculative reach for yield. The other is that extraordinary fiscal policy, coupled with household savings near record lows, have joined to elevate profit margins more than 70% above their historical norm, as the deficit of one sector has to emerge as the surplus of another. The result is that investors quite erroneously accept the distorted “earnings yield” of stocks (and the associated “forward price/earnings multiple” of the S&P 500) at face value, without any adjustment for elevated profit margins or the historical tendency for such elevations to be eliminated over the course of the business cycle.
Put simply, stocks are not cheap, but are instead strenuously overvalued. The speculative reach for yield, encouraged by the Federal Reserve, has created another bubble – which is not recognized as a bubble only because distorted profit margins create the illusion that stocks are reasonably valued. We presently estimate a prospective 10-year nominal total return for the S&P 500 of less than 3.5% annually. The likelihood of even this return being achieved smoothly, without severe intervening volatility and steep market losses, is roughly zero. This does not imply or ensure immediate market losses, but it doesn’t need to. On any horizon of less than about 6-7 years, we expect that any intervening returns achieved by the S&P 500 will be wiped out, and then some. Speculate if you believe that your exit strategy will dominate that of millions of other speculators, despite market conditions that are already overvalued, overbought, overbullish. I n my view, all of this will end badly.
John Mauldin
subscribers@MauldinEconomics.com
Outside the Box is a free weekly economic e-letter by best-selling author and renowned financial expert, John Mauldin. You can learn more and get your free subscription by visiting www.JohnMauldin.com.
Please write to johnmauldin@2000wave.com to inform us of any reproductions, including when and where copy will be reproduced. You must keep the letter intact, from introduction to disclaimers. If you would like to quote brief portions only, please reference www.JohnMauldin.com.
John Mauldin, Best-Selling author and recognized financial expert, is also editor of the free Thoughts From the Frontline that goes to over 1 million readers each week. For more information on John or his FREE weekly economic letter go to: http://www.frontlinethoughts.com/
To subscribe to John Mauldin's E-Letter please click here:http://www.frontlinethoughts.com/subscribe.asp
Copyright 2013 John Mauldin. All Rights Reserved
Note: John Mauldin is the President of Millennium Wave Advisors, LLC (MWA), which is an investment advisory firm registered with multiple states. John Mauldin is a registered representative of Millennium Wave Securities, LLC, (MWS), an FINRA registered broker-dealer. MWS is also a Commodity Pool Operator (CPO) and a Commodity Trading Advisor (CTA) registered with the CFTC, as well as an Introducing Broker (IB). Millennium Wave Investments is a dba of MWA LLC and MWS LLC. Millennium Wave Investments cooperates in the consulting on and marketing of private investment offerings with other independent firms such as Altegris Investments; Absolute Return Partners, LLP; Plexus Asset Management; Fynn Capital; and Nicola Wealth Management. Funds recommended by Mauldin may pay a portion of their fees to these independent firms, who will share 1/3 of those fees with MWS and thus with Mauldin. Any views expressed herein are provided for information purposes only and should not be construed in any way as an offer, an endorsement, or inducement to invest with any CTA, fund, or program mentioned here or elsewhere. Before seeking any advisor's services or making an investment in a fund, investors must read and examine thoroughly the respective disclosure document or offering memorandum. Since these firms and Mauldin receive fees from the funds they recommend/market, they only recommend/market products with which they have been able to negotiate fee arrangements.
Opinions expressed in these reports may change without prior notice. John Mauldin and/or the staffs at Millennium Wave Advisors, LLC and InvestorsInsight Publishing, Inc. ("InvestorsInsight") may or may not have investments in any funds cited above.
Disclaimer PAST RESULTS ARE NOT INDICATIVE OF FUTURE RESULTS. THERE IS RISK OF LOSS AS WELL AS THE OPPORTUNITY FOR GAIN WHEN INVESTING IN MANAGED FUNDS. WHEN CONSIDERING ALTERNATIVE INVESTMENTS, INCLUDING HEDGE FUNDS, YOU SHOULD CONSIDER VARIOUS RISKS INCLUDING THE FACT THAT SOME PRODUCTS: OFTEN ENGAGE IN LEVERAGING AND OTHER SPECULATIVE INVESTMENT PRACTICES THAT MAY INCREASE THE RISK OF INVESTMENT LOSS, CAN BE ILLIQUID, ARE NOT REQUIRED TO PROVIDE PERIODIC PRICING OR VALUATION INFORMATION TO INVESTORS, MAY INVOLVE COMPLEX TAX STRUCTURES AND DELAYS IN DISTRIBUTING IMPORTANT TAX INFORMATION, ARE NOT SUBJECT TO THE SAME REGULATORY REQUIREMENTS AS MUTUAL FUNDS, OFTEN CHARGE HIGH FEES, AND IN MANY CASES THE UNDERLYING INVESTMENTS ARE NOT TRANSPARENT AND ARE KNOWN ONLY TO THE INVESTMENT MANAGER.
John Mauldin Archive |
© 2005-2022 http://www.MarketOracle.co.uk - The Market Oracle is a FREE Daily Financial Markets Analysis & Forecasting online publication.