


Stock Market Leading Indicators: All Showing Major Weakness
Stock-Markets / Stocks Bear Market Mar 12, 2008 - 04:14 AM GMTBy: Donald_W_Dony

 The important key leading indicators on the Dow Jones Industrial Average have one item in common now that has not been shown before; they are all displaying weakness. This unified first signals that the U.S. bear market has now moved into a stronger phase and can be expected to show more of its teeth over the next 1-2 years.
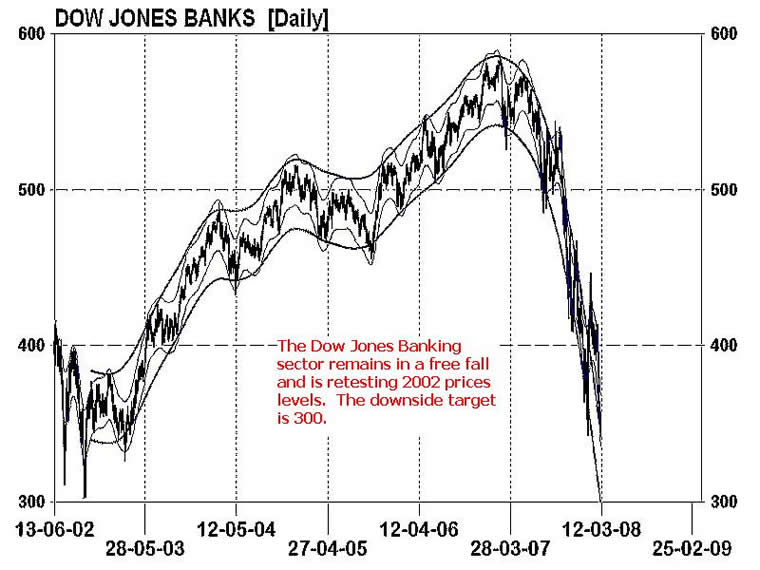
In Chart 1 of the Dow Jones Banks sector, this important measure of economic strength has remained in a waterfall drop since March 2007. Continued negative fundamental data emerges almost weekly for the banks and earnings projections remain soft. This group of companies have reached 2002 price levels and should find some short-term support there over the next few months. Long-term technical models indicate additional weakness can be expected in 2008.
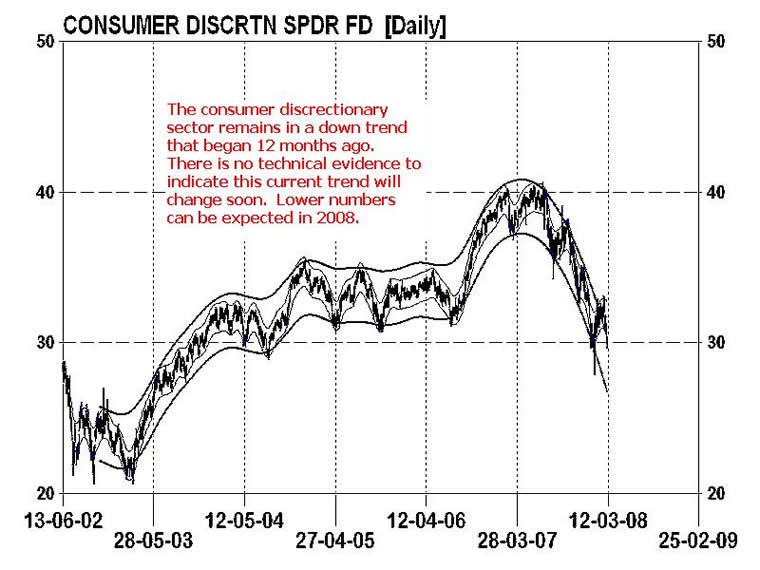
The consumer discretionary sector (Chart 2) is normally one of the first groups to rally when a new bull market begins. This consumer sensitive group is showing no signs of a change in trend. It has recently broken a key support line of $32 and is expected to drop lower in 2008. The consumer discretionary sector is a reflection on how the consumer is feeling about the economy. This prolonged down trend indicates a pullback in spending and a direct shift out of items that are considered unnecessary. As the consumer equals 2/3rds of the economy, their current spending pattern foreshadows ongoing weakness and a slowing of the U.S. economy.
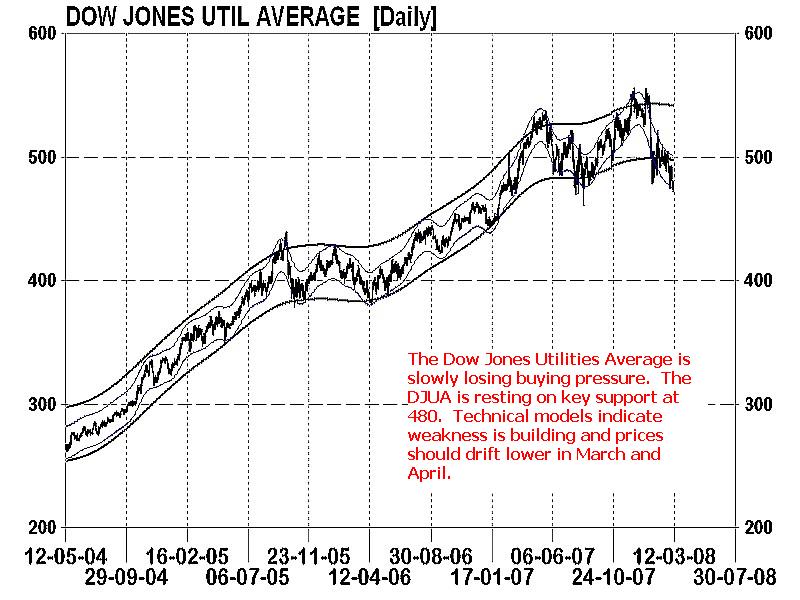
The Dow Jones Utilities Average (DJUA) has been one of the few leading indicators on the U.S. equity market that has remain positive. However, in recent weeks, this reliable leader to the Dow Jones Industrial Average has begun to falter. Increasing selling pressure has halted its advance and pushed this group of companies lower. The Dow Jones Utilities Average (Chart 3) now rests on the 480 key support level. Technical models indicates that weakness is building and lower number are expected over the next 4-6 weeks. The downside target is 420.
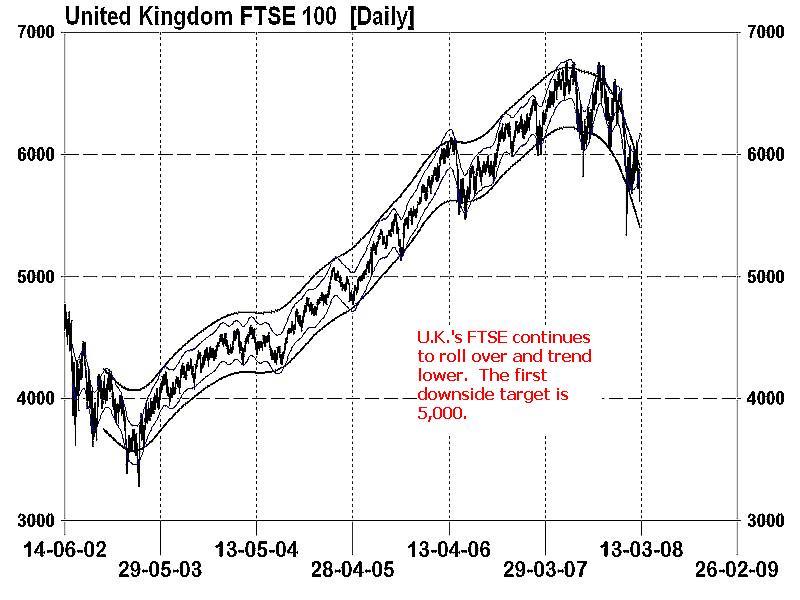
The financially heavy FTSE also has an impressive record for leading the Dow Jones Industrial Average. The UK's FTSE 100 (Chart 4) broke the 2002-2007 bull market up trend in December and continues to step lower. The known and unknown structured credit exposure to the UK's financial system continues to keep investors on the sidelines. The FTSE has a downside target of 5,100.
Bottom line: Leading indicators of the U.S. equity markets are moving in concert lower. These indicators normally lead the stock market by 6-12 months. As there is no technical evidence of any long-term trend reversals or even finding solid price support, this would suggest additional downward pressure can be expected for the equity markets in 2008. This action coordinates with the topping of the 2006-2010 business cycle. The peak in the cycle is associated with rising unemployment, weakening earnings and Fed reduction in interest rates.
Investment approach: As the crest in the 4 year stock and business cycles have developed approximately mid-term, the likelihood of another 1-2 years of down trending equity markets is large. Commodities are one of the few investments that remain in a secular bull market. As the Fed will continue to cut interest rates over the 1-2 years, the USD will drift lower which will escalate inflationary pressures and drive raw material prices higher. ETFs are an excellent vehicle to capture the commodity rise. Gold, oil, agriculture and natural gas will all take advantage of the declining US dollar.
Additional research can be found in the March newsletter. Go to www.technicalspeculator.com and click on member login.
Your comments are alway welcomed.
By Donald W. Dony, FCSI, MFTA
www.technicalspeculator.com
COPYRIGHT © 2008 Donald W. Dony
Donald W. Dony, FCSI, MFTA has been in the investment profession for over 20 years, first as a stock broker in the mid 1980's and then as the principal of D. W. Dony and Associates Inc., a financial consulting firm to present. He is the editor and publisher of the Technical Speculator, a monthly international investment newsletter, which specializes in major world equity markets, currencies, bonds and interest rates as well as the precious metals markets.
Donald is also an instructor for the Canadian Securities Institute (CSI). He is often called upon to design technical analysis training programs and to provide teaching to industry professionals on technical analysis at many of Canada's leading brokerage firms. He is a respected specialist in the area of intermarket and cycle analysis and a frequent speaker at investment conferences.
Mr. Dony is a member of the Canadian Society of Technical Analysts (CSTA) and the International Federation of Technical Analysts (IFTA).
Donald W. Dony Archive |
© 2005-2022 http://www.MarketOracle.co.uk - The Market Oracle is a FREE Daily Financial Markets Analysis & Forecasting online publication.