


Australia Stocks Bear Market Forecast 2013
Stock-Markets / Austrailia Apr 02, 2013 - 11:08 AM GMTBy: readtheticker

 Australia has been called the lucky country, its big and beautiful and unfortunately exposed to massive downside risk.
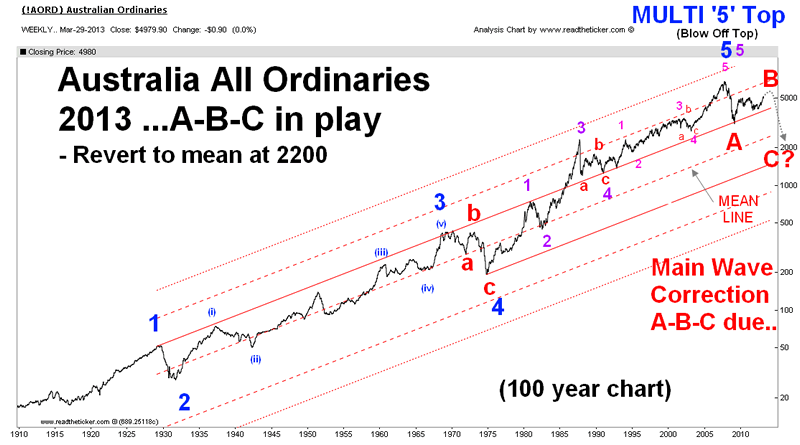
Applying the Elliot wave to price charts is an art with a little science. However in the case of the Australian All Ordinaries Index (AORD) the Elliot Wave 5 count is very easy. A technical Elliot Wave point is that a 5 wave count marks the end of the rally, yet you can have multiple 5 wave counts in a wave that end together. When you get multiple 5th waves peaking together it is an 'OMG' moment ('oh my god') as it resembles increased downside risk to follow.
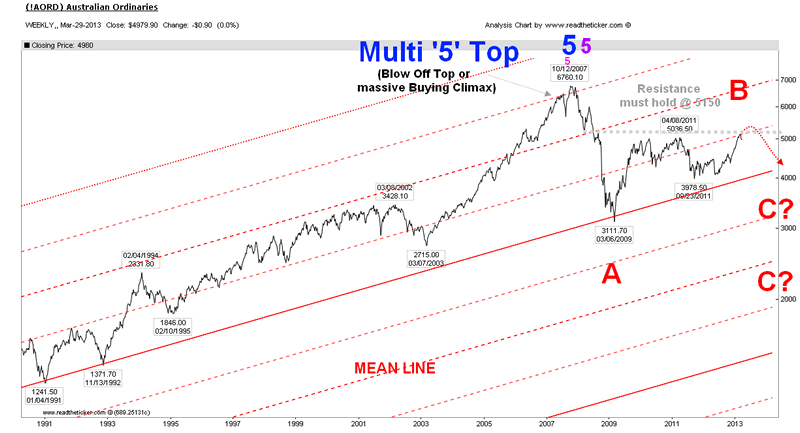
The AORD had a multiple 5 wave top in Oct 2007. Since the peak an A-B-C correction for the complete move from 1910 has started. We have had the A-B, but await the C. The C wave can be devastating and return the AORD all the way down to the mean (see mean line in chart) near 2000 pts (ouch). The C wave can be nothing short of nasty.
(NOTE: Readtheticker.com uses Elliot Wave when it is relative, we are not a primary Elliot Wave site, we are a Wyckoff, Hurst and Gann site first, yet we do have 100 year charts.)
The AORD's with Elliot Wave
Close up...
Hang on, stop the bus, there is no way prices can drop 50% or more based on a Elliot Wave count, seriously how could this happen?
Good question. Here is a game play that could see this happen during the next 2 to 4 years.
The Australian housing market has been described as one of the last untouched bubbles since the 2008 financial crisis. It did not crack in 2008 due to the massive stimulus undertaken within the Asian region (China injected 20% of GDP into it's economy, Australia new home buyer stimulus, Japan on going stimulus). The current state of the Aussie housing bubble is that a 'Joe Blogs' house sells for 18x the average wage (and that is not including the outrageous house prices in Sydney). The private debt behind the Aussie residential property market is a massive 140% of GDP (seeSteve Keen chart). Therefore if the residential housing market pops only 20% the effect on the Australian economy would be equal to a depression (ie a drop of GDP by 10%).
You can learn more about the Aussie housing bubble, here, here and here.
The truth is the Aussie housing market won't die easy, it will need an economic shock to rock the board rooms of the very few banks that control the Aussie housing market. Question, what could send the bankers screaming to protect their balance sheets and avoid to be last to raise capital from the consumer by reducing mortgage exposure while asset prices are falling? Answer, an export lead recession.
Consider some Australian GDP basic maths.
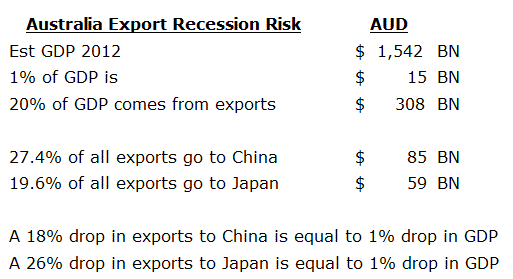
The glow of the mining boom in Australia has already faded. Exports have slowed (see BHP share price), mine capacity has been reduced and jobs and incomes have suffered. So far the slow down is not devastating, but it is very important to note that Australia has two very large export customers that dominate 50% of all Australian exports namely China and Japan. Decisions made in China and Japan have a direct and a very real effect of the lively hoods of every day Australians.
Policy decisions in China that could reduce demand for Australian Exports: China is trying to bust their own property bubble in order to tame inflation. The new Chinese leadership is now confirmed, thus allowing the path clear to make the tough decisions. The Chinese economy is 80% construction, with a huge reliance on Australian minerals, coal and iron. The controlling inflation game can only be won by slowing down the economy, this means a slow down for Aussie exporters. The problem is the phrase 'slow down' is a kind term, some even use 'soft landing', the truth is to tame the inflation dragon will most likely require a hard landing or a 'hum dinger' recession.
Policy decisions in Japan that could reduce demand for Australian Exports: Japan is currently undergoing a massive devaluation of the yen. A falling yen means an increase in import costs, which will result in higher inflation that will lead to higher interest rates. Japan already pays 25% of all government income to pay interest while interest rates are at 0%, if interest rates rise with out income then the government interest rate bill could easily swamp government income by 100%. This means Japan will be bust, and in a depression. Can it happen, sure can says Kyle Bass (watch an amazing video by the man who made bank on the us subprime crisis and the Greek sovereign debt crisis). A slowing economy in Japan is less demand for Australian exports.
Summary
- The Australian All Ordinaries stock market index (AORD) has shown a multiple 5 Elliot Wave top.
- The Elliot Wave multiple 5 wave top is a very extreme bearish reading.
- The A-B-C correction phase has yet to complete the devastating wave 'C'
- The wave 'C' could easily revert the AORD back to the mean at 2000 pts
- 20% of the Australian economy is exports, of which 50% are to China and Japan.
- China is tightening its economy to tame inflation by slowing the economy, which reduces demand for Aussie exports.
- Japan is trying to create Inflation via currency depreciation which will most likely fail and result in Japanese depression and this will of course reduce demand for Aussie exporters.
- The collapse in Australian exports will result in a capacity, employment, income, economic and residential property collapse equal to depression levels (ie 10% of GDP).
- The AORD is not a large market, the share float is small compared to true international markets, large selling will see the market move far and fast to the down side. The nasty 'C' wave.
Question, what could the Australian Government do to combat an economic collapse?
Answer, currently the Australian government debt to GDP% is a very low 20%, and even after a fall of 10% GDP government debt would still be very low. This allows the government to stimulate, bailout or fund programs to help contain a residential property crisis. Of course they will need to find a lender, or print the money themselves and have political will to do so.
Must mention the global economic recession risk. The three main economic zones, Europe, Asia and North America GDP status is: Europe: In recession and getting worse. Asia: At recession door. North America: USA posted a 0.34% GDP for the 4th quarter 2012, maybe in full recession by the end of 2013. Of course China and Japan are huge export nations, and while their major customers have shrinking economies internal demand will suffer and this of course leads to lower demand for Australian exports products.
Possible plays:
- Short AUDUSD on a clean break below $0.94
- Watch listed Australian exporters price action: BHP, RIO
The above is a game plan, it may not happen, but like all market followers the reader must watch for signs that the above is about to eventuate. Of course readtheticker.com via our RTTPlus service will be watching the 100 year Australian All Ordinary (AORD) index like a hawk. (To Aussie readers, yes we do have the top 50 stocks within our database).
Readtheticker
My website: www.readtheticker.com My blog: http://www.readtheticker.com/Pages/Blog1.aspx
We are financial market enthusiast using methods expressed by the Gann, Hurst and Wyckoff with a few of our own proprietary tools. Readtheticker.com provides online stock and index charts with commentary. We are not brokers, bankers, financial planners, hedge fund traders or investment advisors, we are private investors
© 2013 Copyright readtheticker - All Rights Reserved
Disclaimer: The material is presented for educational purposes only and may contain errors or omissions and are subject to change without notice. Readtheticker.com (or 'RTT') members and or associates are NOT responsible for any actions you may take on any comments, advice,annotations or advertisement presented in this content. This material is not presented to be a recommendation to buy or sell any financial instrument (including but not limited to stocks, forex, options, bonds or futures, on any exchange in the world) or as 'investment advice'. Readtheticker.com members may have a position in any company or security mentioned herein.
© 2005-2022 http://www.MarketOracle.co.uk - The Market Oracle is a FREE Daily Financial Markets Analysis & Forecasting online publication.