


Stock Market Flying High on Borrowed Wings
Stock-Markets / Stock Markets 2013 Apr 01, 2013 - 07:41 PM GMTBy: Peter_Schiff

 After selling off an astounding 56% between October of 2007 and March 2009, the S&P 500 has staged a rally for the ages, surging 120% and recovering all of its lost ground too. This stunning turnaround certainly qualifies as one of the more memorable, and unusual, stock market rallies in history. The problem is that the rally has been underwritten by the Federal Reserve's unconventional monetary policies But for some reason, this belief has not weakened the celebration.
Although the Fed has been tinkering with interest rates and liquidity for a century, nothing in its history could prepare the markets for its activities over the last four years. (See 'The Stimulus Trap' article in my latest newsletter). And while most market analysts give credit to Ben Bernanke for saving the economy and sparking the rally, they have not fully grasped that market performance is now almost completely correlated to Fed activism. A detailed look at stock market movements over the past four years reveals a clear pattern: upward movements are directly tied to the delivery of fresh stimulants from the Fed. Downward movements occur when markets perceive that the deliveries will stop. In other words, the rally is really just a bender. The rest is commentary.
Since 2008, the Fed has injected fresh cash into the economy with four distinct shots of quantitative easing and has added two kickers of Operation Twist. In recent months, the Fed has dispensed with the pretense of designing, announcing, and serving new rounds of stimulus and is now continuously monetizing over $85 billion per month of Treasury and mortgage-backed debt. The new cash needs a place to go, and stocks, which now often provide higher yields than long term Treasury bonds, and which offer much better protections against inflation, provide the best outlet.
But the four year rally has been punctuated by several sharp and brief drops. It is no coincidence that these episodes occurred during periods in which the delivery of fresh stimulus was in doubt. If the Fed were ever to follow through on its promise to exit the bond market, we believe the current rally would come to an immediate halt. This provides yet another reason to believe that stimulus is now permanent.
A close look at the performance of the S&P 500 over the past four years tells the story.
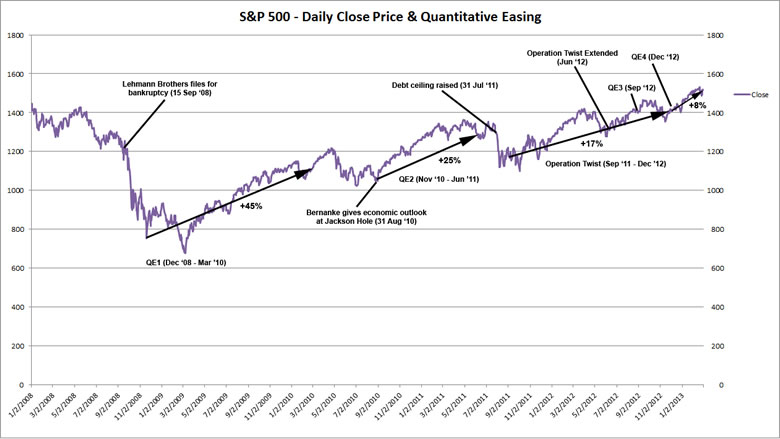
Source: Yahoo! Finance
In May 2007, with the "Goldilocks" economy of 2005 and 2006 still in control, the S&P finally eclipsed the March 2000 high of the dotcom era. It ultimately hit an all-time high of 1565 in October 2007. But later in the year, things began to unravel when bankruptcies of premier subprime lenders signaled real trouble. A blood bath, though, did not materialize. As late as August 2008, the S&P was trading at nearly 1300, down a less-than-tragic 16% from its high. But when Lehman Brothers, Fannie Mae and Freddie Mac, and AIG imploded almost simultaneously in September 2008, the markets panicked. Hundreds of billions of dollars of potentially worthless debt now sat on the books of the nation's financial system. No one knew where the next bomb would explode. A stampede thus ensued. (A minor replay of this dynamic just occurred in Cyprus. See my recent commentary for more on this).
Less than a month later the index fell below 900, a fall of more than 30%. By November 21, the S&P had lost another 100 points. Four days later, the Fed introduced the first round of what would come to be commonly known as "quantitative easing". This consisted of purchasing $600 billion of government-sponsored enterprises debt and mortgage-backed securities. By the day of the announcement (even though nothing had yet been done), the S&P rallied almost 50 points to 851. Still encouraged by the Fed, the S&P was at 931 on January 6, 2009, significantly higher than in late November.
Despite the first round of asset purchases, the market was still in chaos and had not yet stabilized. By early March, the S&P had lost an additional 25%, bringing total "peak-to-trough" losses at more than 50%. On March 18, 2009, the Fed announced that it was going to expand the size of its stimulus program. This time it really got the stock market's attention. The new guidelines called for a total purchase of $1.25 trillion of MBS and $300 billion of Treasury debt. On the day of the announcement, the S&P opened at 776 and by the time the asset purchases were complete a year later, in March 2010, the S&P was trading at 1171, an increase of 50%.
When the spigots of quantitative easing shut down in the second quarter of 2010 the S&P turned south, declining to a low of 1022 in July (a 13% decline from March). In late August, just before Bernanke delivered his 2010 Jackson Hole speech, in which he would hint at the next round of stimulus (to be later dubbed "QE2"), the S&P was still hovering a full 10% below its post QE1 high. But the expectation of another shot was enough to ignite a rally. When the formal announcement of QE2 came in November, the index had already advanced to 1193. When the program expired at the end of the 2nd quarter of 2011, the S&P stood at 1307, a 25% increase from before Bernanke jawboned the markets at Jackson Hole.
The market response to QE2 was in many ways similar, if less spectacular, than its prior response to QE1. And like the first go-round, the rally ended with the withdrawal of stimulus. In addition, after the cessation of QE2, the markets had to contend with the farce of the U.S. debt ceiling drama. As a result, the S&P declined from a high of 1343 on July 22 to 1123 by August 19, a drop of 16%. This is also the same time period when the U.S. received its downgrade by Standard and Poor's. Ironically, the U.S. eventually got a temporary reprieve from the spotlight when its problems became overshadowed by funding tensions in Greece and Southern Europe, causing the market to once again flock to the so-called "safe haven" of U.S. assets.
The cover from Europe could only go so far. Pressure soon began to build on the Fed to deliver once again. It acted in September 2011 with its "Operation Twist", a program that consisted of buying longer-term treasuries while selling an equal amount of shorter dated paper. Although Twist was advertised as being balance sheet neutral, the short-term sales the Fed made were somewhat offset by the extension of credit lines to Europe and an extended commitment to the 0% interest rate policy that at the time called for an end date of mid-2013. The day the Fed announced Operation Twist, the S&P opened at 1203. By the following April it had reached 1400, a return of 16%.
But once again the stimulus began to fade. In the second quarter of 2012, a sell off took hold, and by June 5, the S&P traded as low as 1277, a decline of 9% since April. Cue the Fed! On June 20, the Fed announced the extension of Operation Twist, sparking a new rally which has continued into 2013. This buoyancy has been maintained, in part, by the announcement of QE3 on September 13, 2012, which also included another extension of the zero interest rate policy until at least mid-2015. By October, Fed governors were already mentioning inflation targets and when QE4 was launched on December 12, they clarified that zero interest rate policies would be in place until unemployment fell below 6.5%. The current leg of the rally has been somewhat non-linear as the election, the Fiscal Cliff, and the endless empty headlines out of Europe have continued to put pressure on the markets. Despite these obstacles, the S&P has rallied past 1500 and on March 5, 2013, it closed at 1538, within shouting distance of its all-time high of 1576 on October 11, 2007.
When the Fed made the first round of asset purchases in November of 2008, the market was still in a state of flux. However, since the system stabilized in mid 2009, there has been a reliable correlation between the timing of the programs and the performance of the markets. This intention was stated explicitly in Ben Bernanke's November 4,2010, Washington Times Op-ed in which he provided the rationale for QE2:
"This approach eased financial conditions in the past and, so far, looks to be effective again. Stock prices rose and long-term interest rates fell when investors began to anticipate the most recent action. Easier financial conditions will promote economic growth. For example, lower mortgage rates will make housing more affordable and allow more homeowners to refinance. Lower corporate bond rates will encourage investment. And higher stock prices will boost consumer wealth and help increase confidence, which can also spur spending."
With the Fed on pace to expand its balance sheet by over $1 trillion in 2013, there can be little doubt that much of that money is headed straight into the stock market. Treasury bonds are still offering negative real yields and so there is less incentive than ever to own government paper.
Recently, the New York Post's Jonathan Trugman pointed out that Citigroup could be considered the poster child of the dubious rally. Since the crisis began, he reports that the Bank has received $45 billion in TARP funding, an additional $45 billion line of credit from the Treasury, and a government guarantee of $300 billion for its own troubled assets. At the same time, its cost of capital (the money it borrows from the Fed) is near zero, while it earns 3% to 5% on mortgages and 12% to 18% on credit cards. But from an operational standpoint, those gifts have failed to create a flourishing, self-sustaining, business. The company had shed almost 100,000 employees from its period of peak employment a few years ago (down to 260,000 employees) and it announced three months ago that an additional 11,000 cuts are to come. But Citi's share price has risen more than 85 percent since June of 2012, despite scant evidence that the company has turned itself around.
But look what all the Fed intervention has wrought. Each time they have intervened the resulting rally has diminished in intensity, and a sell-off has always ensued when the drug wore off. Through the years, the cycle of stimulus administration has quickened pace and has now arrived at a stage where it is continuous. Currently, the Fed is talking about a potential exit strategy, but as we have argued in the past, and as the chart above surely indicates, any withdrawal of stimulus could likely have dire implications for stocks which will not be tolerated by Washington.
Japan has been unsuccessfully trying to inflate its way out of these problems for the past 20 years (see 'Japan's Dangerous Game' in my latest newsletter). Now many of the indebted nations of the developed world seem intent to follow that example. But the monetary experiment of unending stimulus has, up to now, never been tried on a global scale. No one knows when or how it will end, but I believe it will end badly.
Investing in stocks is supposed to be a way to harness real economic growth, not a way to front run stimulus. Our advice for stock investors is to recognize that and to get as far away from artificially induced highs as possible. More fundamentally sound markets exist. We just have to find them.
Peter Schiff is the CEO and Chief Global Strategist of Euro Pacific Capital, best-selling author and host of syndicated Peter Schiff Show.
Subscribe to Euro Pacific's Weekly Digest: Receive all commentaries by Peter Schiff, John Browne, and other Euro Pacific commentators delivered to your inbox every Monday!
And be sure to order a copy of Peter Schiff's recently released NY Times Best Seller, The Real Crash: America's Coming Bankruptcy - How to Save Yourself and Your Country.
Regards,
Peter Schiff
Euro Pacific Capital
http://www.europac.net/
Peter Schiff Archive |
© 2005-2022 http://www.MarketOracle.co.uk - The Market Oracle is a FREE Daily Financial Markets Analysis & Forecasting online publication.