Stock Market Breakouts All Around; Final Countdown or the Beginning of a New Cycle?
Companies / Investing 2013 Mar 27, 2013 - 09:33 AM GMT So many blue chips are pushing their all-time record highs. The Dow Jones Industrial Average has been leading the stock market breakout, along with the Dow Jones Transportation Average.
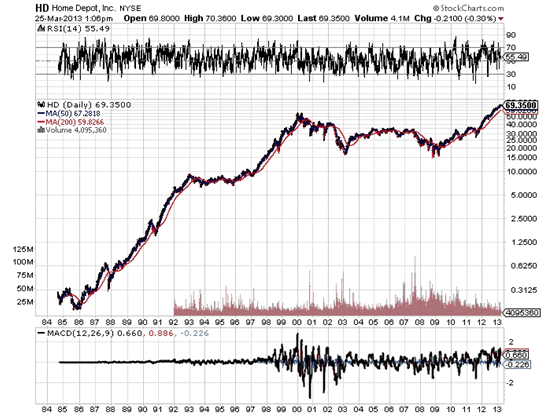
The Home Depot, Inc. (NYSE/HD) continues to be a powerhouse stock, more than doubling since October 2011. This position is in its own mini bull market, after a sustained period of sideways trading for 12 years.
This is how so many blue chips trade. They go through sustained periods of nonperformance on the stock market (still paying their dividends), and then they blast higher. It’s a cycle, and you can see it in Home Depot’s very long-term chart below. From 1986 to 1992, Home Depot’s share price skyrocketed; then it was flat for four years. It plowed higher from 1997 to 2000; then it did nothing for the next 12 years.

Chart courtesy of www.StockCharts.com
Countless blue chips trade like this. The Procter & Gamble Company (NYSE/PG) had an earnings miss just at the height of the stock market’s bubble in 2000. The stock lost half its value and took about 10 years to break beyond its 2000 high.
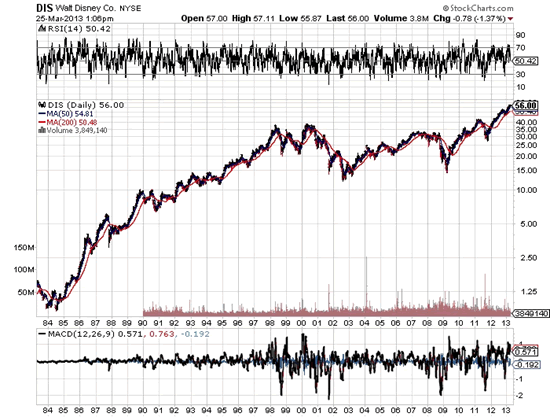
One of many blue chips that stand out for their huge cyclical price trends is The Walt Disney Company (NYSE/DIS). From 1967 to 1973, the stock moved strongly higher with three share splits. Then it did nothing for the next 13 years.
In 1986, Disney took off on the stock market, appreciating consistently until the beginning of 1997. Then it did nothing until 2012, when it finally broke out of its long-term sideways pattern. Disney’s long-term chart is below:

Chart courtesy of www.StockCharts.com
Powerful stock market breakouts in blue chips make me take serious notice. All the arguments for the stock market’s recovery since the financial crisis are valid (huge increase in the money supply, artificially low interest rates, and so on). Disney and so many other blue chips have broken out of the stock market’s sideways action over the last 12 years. To me, this is very significant and the trading action in these blue chips is reminiscent of their previous cycles.
It’s the continuing uncertainty after the shock of the subprime mortgage-induced bubble that is holding back corporations and individuals from making new investments. Blue chips and other large-caps have broken out on low volume in what could very well be the beginning of a major new upcycle in equities. (See “From Financial Crisis to Bubble, Is the Next Cycle Now in Play?”)
Likely, the U.S. economy will experience another recession (eurozone inspired?) and significant stock market pullback before the new business cycle begins. Look for one final cleanout and then a multiyear period of rising prices.
Source - http://www.profitconfidential.com/stock-market/breakouts-all-aroun...
By Mitchell Clark, B.Comm. for Profit Confidential
http://www.profitconfidential.com
We publish Profit Confidential daily for our Lombardi Financial customers because we believe many of those reporting today’s financial news simply don’t know what they are telling you! Reporters are trained to tell you the news—not what it can mean for you! What you read in the popular news services, be it the daily newspapers, on the internet or TV, is the news from a “reporter’s opinion.” And there’s the big difference.
With Profit Confidential you are receiving the news with the opinions, commentaries and interpretations of seasoned financial analysts and economists. We analyze the actions of the stock market, precious metals, interest rates, real estate and other investments so we can tell you what we believe today’s financial news will mean for you tomorrow!
© 2013 Copyright Profit Confidential - All Rights Reserved
Disclaimer: The above is a matter of opinion provided for general information purposes only and is not intended as investment advice. Information and analysis above are derived from sources and utilising methods believed to be reliable, but we cannot accept responsibility for any losses you may incur as a result of this analysis. Individuals should consult with their personal financial advisors.
© 2005-2022 http://www.MarketOracle.co.uk - The Market Oracle is a FREE Daily Financial Markets Analysis & Forecasting online publication.


