Hyperinflation? No. Inflation? Yes
Economics / HyperInflation Mar 25, 2013 - 06:57 PM GMTBy: Steve_H_Hanke
 While inflation seems to be on everyone’s mind these days, misconceptions abound. Indeed, few concepts in economics are as misunderstood as inflation. This month I take a look at some common questions about inflation, and a few that I wish more people were asking.
Is hyperinflation coming to the U.S.?
No. Hyperinflation arises only under the most extreme conditions, such as war, political mismanagement, or the transition from a command economy to a market-based economy. If you compare the U.S. to countries that have experienced hyperinflation– think Iran, North Korea, Zimbabwe, and the former Yugoslavia, for example — the U.S. doesn’t even come close. Hyperinflation begins when a country experiences an inflation rate of greater than 50% percent per month — which comes out to about 13,000% per year. Although it experienced elevated inflation around the time of the Revolution and the Civil War, the United States has never passed this magic mark. At present, the U.S. inflation rate, measured by the consumer price index (CPI), is less than 2% per year. So, to say that the U.S. is on its way to hyperinflation is just nonsense.
But what about Quantitative Easing? Won’t that cause high inflation?
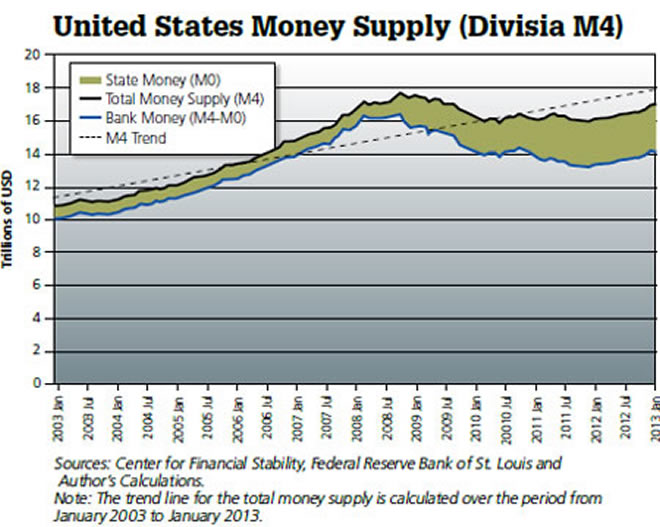
No, at least not under the current QE program. What many people fail to understand is that the money created by the Fed, through programs like Quantitative Easing, is what’s known as “state money” (monetary base). In the U.S., this makes up only 15% of the money supply, broadly measured. The remainder is made up of “bank money” — the allimportant portion of the money supply produced by banks, through deposit creation.
So, while the Fed has more than tripled the supply of state money since the collapse of Lehman Brothers, in September 2008, this component of the money supply is still paltry compared to the total money supply. In fact, when measured broadly, using a Divisia M4 metric, the U.S. money supply is actually 6% below trend (see the accompanying chart).
There are a number of factors that affect the growth of money, but there are two main factors that have hamperedbroad money growth in the United States since the financial crisis. Not surprisingly, they are both government created.The first is the squeeze that has been put on the banks, as a result of Dodd-Frank and Basel III capital-asset ratio hikes. By requiring banks to hold more capital per dollar of assets (read: loans), the regulators have put a constraint on bank’s balance sheets, which limits their ability to lend. In consequence, money supply growth has been slower than it would have otherwise been.
The other factor is the credit crunch created by the Fed’s zero-interest-rate policy. This has dried up the interbank lending market, because banks have little financial incentive to lend to each other. Without a well-functioning interbank lending market to ensure balance sheet liquidity, banks have been unwilling to scale up or even retain their forward loan commitments.
The end result is a loose state money/tight bank money monetary mix. And since bank money makes up 85% of the total, the money supply in the U.S. is still, on balance, tight and below trend. That said, the broad Divisia M4 measure of the money supply has started to show signs of life in recent months.
How Can The Fed Avoid Inflation Going Forward?
The Fed should start paying attention to the dollar. While operating under a regime of inflation targeting and a floating U.S. dollar exchange rate, Chairman Bernanke has seen fit to ignore fluctuations in the value of the dollar. Indeed, changes in the dollar’s exchange value do not appear as one of the six metrics on “Bernanke’s Dashboard” — the one the chairman uses to gauge the appropriateness of monetary policy. Perhaps this explains why Bernanke has been dismissive of questions suggesting that changes in the dollar’s exchange value influence either commodity prices or more broad gauges of inflation.
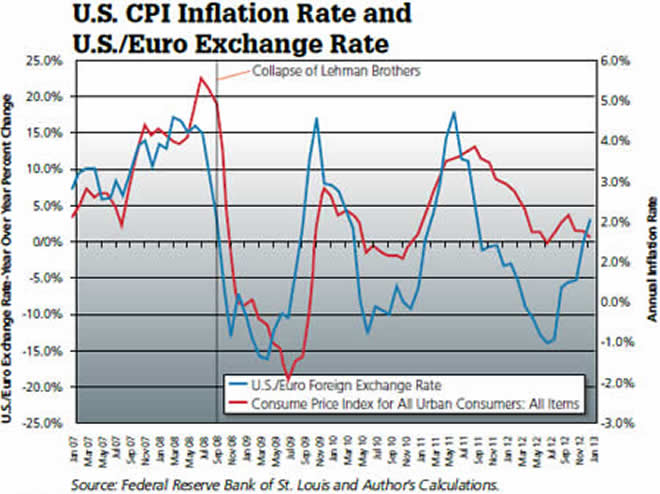
The relationship between the dollar’s value and inflation has been abundantly clear for the last decade. As Nobelist Robert Mundell has convincingly argued, changes in exchange rates transmit inflation (or deflation) into economies, and they can do so rapidly. This relationship was particularly pronounced during the financial crisis (see the accompanying chart).
Indeed, from 2007-09, the monthly year-over-year percent changes in the consumer price index and in the USD/EUR exchange rate have a correlation of 0.75. As can be seen in the chart, there is a roughly two-month lag between changes in the USD/EUR exchange rate and in the CPI; when we factor in this lag, the correlation strengthens to 0.94.
By ignoring this, Bernanke was “flying blind” in the initial months of the crisis. In consequence, the Fed failed to stabilize the USD/EUR exchange rate, which swung dramatically in the months surrounding the collapse of Lehman Brothers.
Accordingly, the Fed acted too slowly in cutting the federal funds rate to stabilize inflation, which swung from an alarming rate of over 5% (year-over-year), to a negative (deflationary) rate in a matter of a few short months. If Bernanke had been monitoring the USD/EUR exchange rate, he would have realized that he was engaging in an ultra-tight monetary policy in the early months of the financial crisis. He would have known then to act much sooner than December 2008 — almost two months after the Lehman bankruptcy. Perhaps if he had tried to stabilize the value of the greenback, the bankruptcy may never have occurred in the first place.
How Does the Value of the Dollar Influence Inflation?
One important way the dollar’s value affects inflation is through commodity prices. With few exceptions, when the dollar weakens against the euro, commodity prices soar, and when the dollar soars against the euro, commodity prices plunge. As every commodity trader knows, when the value of the dollar falls, the nominal dollar prices of internationally traded commodities — like gold, rice, corn and oil — must increase because more dollars are required to purchase the same quantity of any commodity. The linkage between the dollar-euro exchange rate and commodity prices is depicted in the accompanying chart.
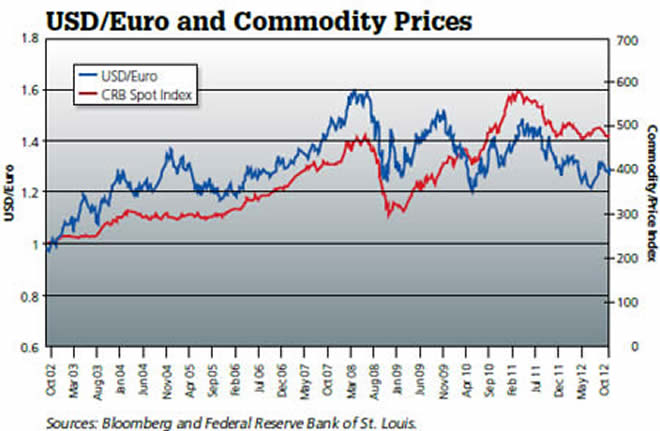
During the 2002–July 2008 period, the dollar declined steeply against the euro, and commodity prices surged. When the dollar subsequently rebounded, after Lehman Brothers collapsed, commodity prices tumbled. And again, following the first quarter of 2009, the renewed decline in the dollar’s exchange rate brought with it another surge in commodity prices.
We can see the consequences of this relationship in the lead-up to the 2008 financial crisis. During the five years preceding the Lehman Brothers’ collapse, the Fed’s favorite inflation target — the consumer price index, absent food and energy prices — was increasing at a regular, modest rate. But, this was an illusion. As can be seen in the accompanying chart, a weakening dollar drove up asset prices in the equities, commodities, and, of course, housing markets.
Unbeknownst to the Fed, abrupt shifts in major relative prices were underfoot. For example, housing prices — measured by the Case-Shiller home price index — were surging, increasing by 45% from the first quarter in 2003 until their peak in the first quarter of 2006. Share prices were also on a tear, increasing by 66% from the first quarter of 2003 until they peaked in the first quarter of 2008.
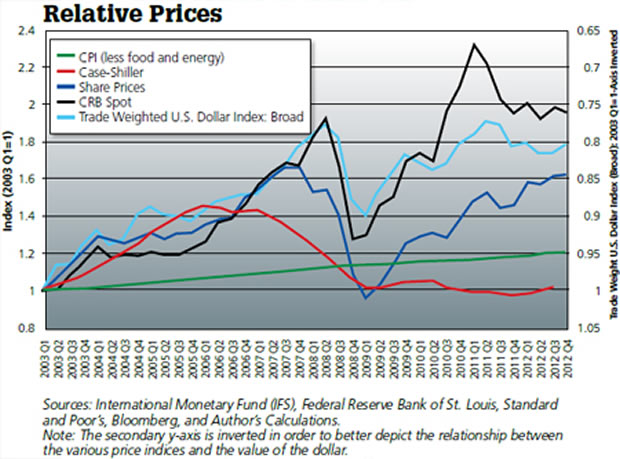
The most dramatic price increases were in the commodities, however. Measured by the Commodity Research Bureau’s spot index, commodity prices increased by 92% from the first quarter of 2003 to their pre-Lehman Brothers peak in the second quarter of 2008.
The dramatic jump in commodity prices was due, in large part, to the fact that a weak dollar accompanied the Fed’s ultra-low interest rates. Measured by the Federal Reserve’s Trade-Weighted Exchange Index for major currencies, the greenback fell in value by 30.5% from 2003 to mid-July 2008.
For any economist worth his salt, these relative price changes should have set off alarm bells. Unfortunately, the Fed’s CPI inflation metric signaled “no problems”.
How Does the Dollar’s Value Affect the Global Economy?
The dollar has become a staple currency for the invoicing of exports, and as a transaction currency in foreign exchange markets. For example, Australia, Korea, Thailand, and Malaysia all have over 70% of their exports invoiced in dollars, even though only 25% of their trade is with the United States. Indeed, in most countries, the share of exports invoiced in dollars is larger than the share of actual exports to the United Sates. Clearly, the dollar has become the “vehicle” currency in international trade.
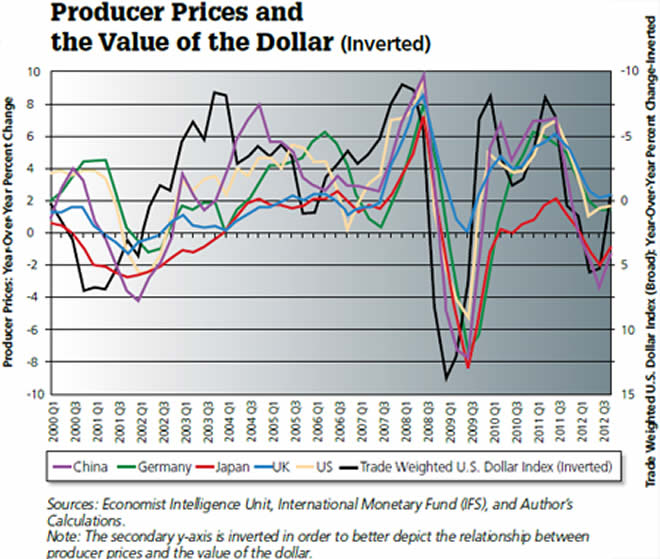
Thus, the dollar dominates the international markets. But, what does this mean when the value of the dollar fluctuates? Well, because of this “dollar standard”, producer prices around the world all move in the opposite direction of the value of the dollar (see the accompanying chart).
Indeed, since 2000, decreases in the value of the dollar have been clearly linked to increases in producer prices around the world. Given the recent loose talk of currency wars, it is little wonder that finance ministers in countries like China and Brazil are worried about a depreciating dollar affecting their producer prices, causing inflationary pressures.
That said, the United States can only expect to stay insulated from elevated inflation in emerging markets for so long. Indeed, while the U.S. money supply remains under trend, leaving inflation in check (for now), we may see inflationary pressures begin to surface before long. That is, unless the greenback continues to finds renewed strength — which has been evident in recent months.
What Can Be Done?
When it comes to exchange rates, stability might not be everything, but everything is nothing without stability. The world’s two most important currencies — the dollar and the euro — should, via formal agreement, trade in a zone ($1.20 - $1.40 to the euro, for example). The European Central Bank would be obliged to maintain this zone of stability by defending a weak dollar (by purchasing dollars). Likewise, the Fed would be obliged to defend a weak euro (by purchasing euros).
The East Asian dollar bloc, which was torpedoed during the 2003 Dubai Summit, should be resurrected — with the yuan and other Asian currencies tightly linked to the greenback. As for other countries (Brazil and Venezuela, for example), they should adopt currency boards, linked to either the dollar or euro. Or, they could simply “dollarize”, by adopting a foreign currency (like the dollar, for example) as their own.
Until we return to a stable, rule-bound international monetary system, inflation will continue to be source of anxiety in economies and asset markets around the world.
This article appeared in the April 2013 issue of Globe Asia.
By Steve H. Hanke
www.cato.org/people/hanke.html
Steve H. Hanke is a Professor of Applied Economics and Co-Director of the Institute for Applied Economics, Global Health, and the Study of Business Enterprise at The Johns Hopkins University in Baltimore. Prof. Hanke is also a Senior Fellow at the Cato Institute in Washington, D.C.; a Distinguished Professor at the Universitas Pelita Harapan in Jakarta, Indonesia; a Senior Advisor at the Renmin University of China’s International Monetary Research Institute in Beijing; a Special Counselor to the Center for Financial Stability in New York; a member of the National Bank of Kuwait’s International Advisory Board (chaired by Sir John Major); a member of the Financial Advisory Council of the United Arab Emirates; and a contributing editor at Globe Asia Magazine.
Copyright © 2013 Steve H. Hanke - All Rights Reserved
Disclaimer: The above is a matter of opinion provided for general information purposes only and is not intended as investment advice. Information and analysis above are derived from sources and utilising methods believed to be reliable, but we cannot accept responsibility for any losses you may incur as a result of this analysis. Individuals should consult with their personal financial advisors.
Steve H. Hanke Archive |
© 2005-2022 http://www.MarketOracle.co.uk - The Market Oracle is a FREE Daily Financial Markets Analysis & Forecasting online publication.


