Gold Price Trend Forecast for April 2013
Commodities / Gold and Silver 2013 Mar 25, 2013 - 11:28 AM GMTBy: Clive_Maund
 With an astronomic and ever growing debt and derivatives overhang, there are essentially only two choices for the world economy. One is to deal with it head on, which would trigger a deflationary implosion that would create an economic wasteland leading to anarchy, riots and revolution etc. Quite clearly nobody wants that, least of all those in power. So that only leaves one other option, which is to keep things limping along for as long as possible by clamping interest rates at zero to stop debt compounding and to print whatever quantity of money is required to keep the status quo going. The big difference between now and 2008 is that this is now a truly global strategy with the WWEW, the World Wide Elite Web, now controlling and directing a coordinated campaign of liquidity enhancement to achieve this objective. For evidence of this you need look no further than the Fed delivering boatloads of newly created cash to the European Union to prop up its banks, or to Japan suddenly abandoning decades of deflationary policy to get with the plan, which is why the yen has collapsed. However, the Fed's generosity towards Europe may not extend to saving the euro, which US elites may view as a nuisance because it potentially undermines the dollar's reserve currency status.
Creating vast quantities of money out of nothing to make available to big banks and the financial sector free of charge must of course have a price, since real wealth cannot be created out of nothing, and that price is monetary debasement, the consequences of which are neatly passed along to the lowest tiers of society via inflation. So the big banks and favored entities and institutions are the direct beneficiaries of the munificence of the money printers, while the bill for it all is passed along to the man in the street via robust inflation.
The need to save the world by clamping interest rates at zero also provides another convenient mechanism for transferring the wealth of the middle and lower classes to the elites. The big banks, as we know, can borrow newly created money for nothing or almost nothing, but when the little guy wants to borrow money for whatever reason he has to pay the banks 4 or 5% interest, so the banks pocket an instant 4 to 5% profit for a little paperwork - not bad work if you can get it. On the other hand, if the little guy actually succeeds in saving some money, and makes the mistake of letting it accumulate in a bank account, what will the banks pay him in interest? - nothing, or next to nothing. This is why the little guy, frustrated at getting no return on his savings in the bank, is encouraged to venture into more risky areas like the stockmarket - which is then cyclically flushed to strip him of his holdings at low prices. To add insult to injury the little guy is then advised that 'for the greater good' he should tighten his belt and endure austerity measures. As if all this isn't enough the size of bars of chocolate is being slyly reduced. The trick for the elites is squeeze the little guy as much as possible so that he is simmering with anger and frustration, but not so much that his anger boils over and he goes on the rampage, which could result in unfortunate consequences, such as bank windows being smashed and bonuses being reduced. Now and then a 'trial balloon' such as Cyprus is floated to see what the little guy's limits are, so that they know what they can get away with later in places like Italy and Spain.
Now, as you know, we are quite above ranting on this site - the point of the above discussion was to make clear that the global elites have charted a course for robust global inflation. Deflation could lead to things quickly getting out of control and a descent into a state of anarchy, which could lead to them losing power and possibly even their lives. Inflation on the other hand, means that they can keep things limping along, maintain the status quo, which benefits them hugely, and engage in the steady transfer of wealth from the poorest sections of society to the richest. This for them is the perfect outcome, and - now we are getting to the point - it means that hard assets with intrinsic value can be expected to remain in uptrends as far as the eye can see - as investors struggle to maintain the value of their assets in the face of the relentless ravages of inflation. Thus there is no reason to fear an end to the ongoing major bullmarkets in gold and silver, and various other hard assets, and that means that the recent trading ranges in gold and silver are not top areas but zones of consolidation ahead of the resumption of the major uptrend.
Having figured the fundamental reasons for the continuance of the bullmarket in gold, let's now look at the charts to see how close we are potentially to the next major uptrend beginning. As we will soon see, it should get underway soon.
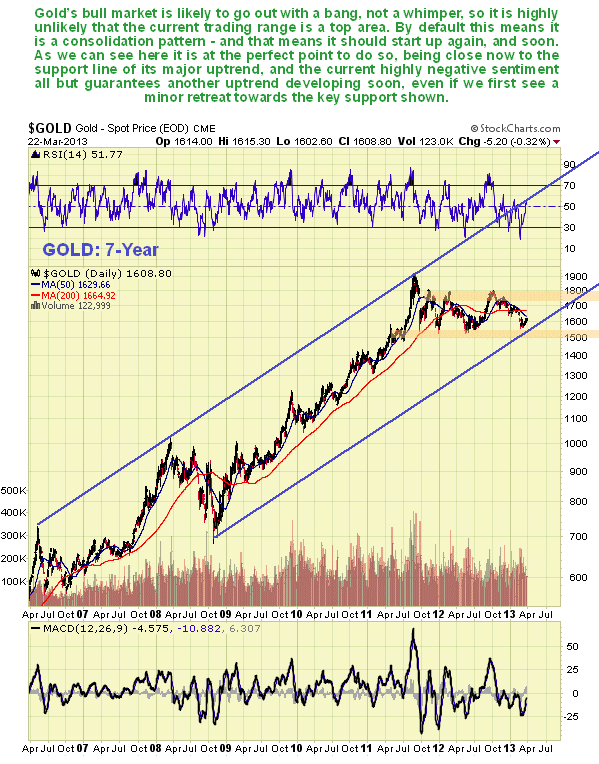
A 7-year chart for gold enables us to neatly delineate its major uptrend channel, the lower supporting trendline of which is drawn as a parallel to the clearly operative top line drawn across 3 important highs. As we can see the trading range that has developed over the past 18 months or so has both allowed the overbought condition that had earlier existed to unwind, and allowed the lower supporting trendline to pull up close below the price, which can be expected to lead to the next major uptrend starting soon.
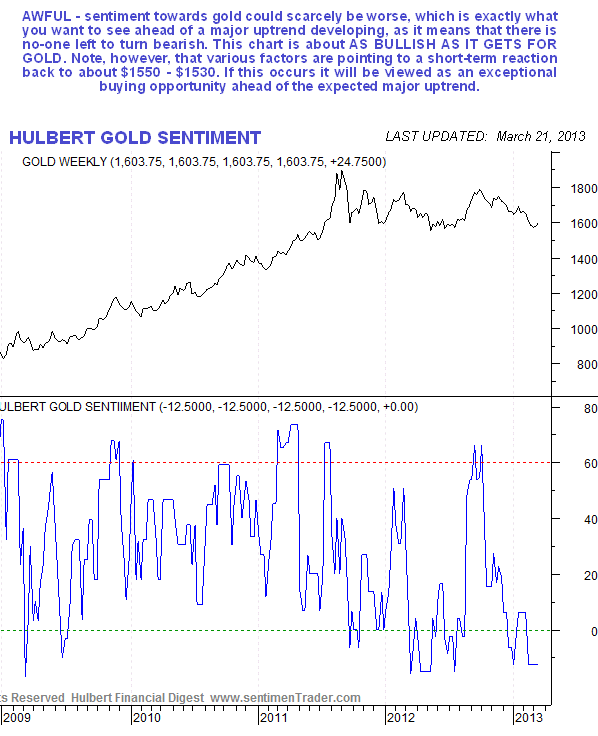
Ideally, what we would like to see just before a major uptrend starts is a very low sentiment reading towards gold. We need as few traders and investors having a positive disposition towards gold as possible - the fewer there are, the less potential new bears there are to drive the price down, the and more there are to turn positive and buy once the price starts rising. Thus, the latest sentiment chart shown below could not look better - it alone signals that a major new uptrend is close at hand.
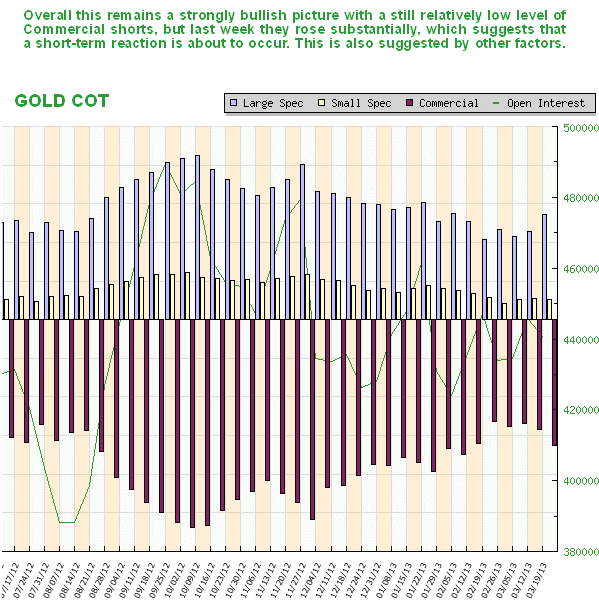
In addition to low positive sentiment towards gold, we also want to see evidence that the Big Money traders have a comparatively low short exposure to gold. The latest COT charts show that this is indeed the case, with the last reading but one showing their lowest short positions in gold for over a year. Overall this is the sort of COT structure we want to see ahead of a major rally - but wait a minute, why the big rise in Commercial short positions last week? This looks like them positioning themselves for a relatively minor short-term pullback, and when we look at the 8-month gold chart further down the page, we will see why they are doing this.
On the 8-month chart for gold we can see that when it crashed the support at its early January intraday low, in mid-February on quite strong volume, it set up resistance just below this level which turned the price back later in February. Now, with the price approaching this level again after the modest rally of the past 2 weeks, it look set to fall back again towards the support near to its lows, particularly as the falling 50-day moving average is coming into play as a negative influence overhead. The neutralized MACD and high MACD histogram reading are also suggesting a probable short-term pullback. This is believed to be the reason that the Commercials have piled on some extra shorts last week. However, given all the other bullish indications that we have looked at this pullback, if it occurs, should be the last one before the expected major uptrend gets underway.
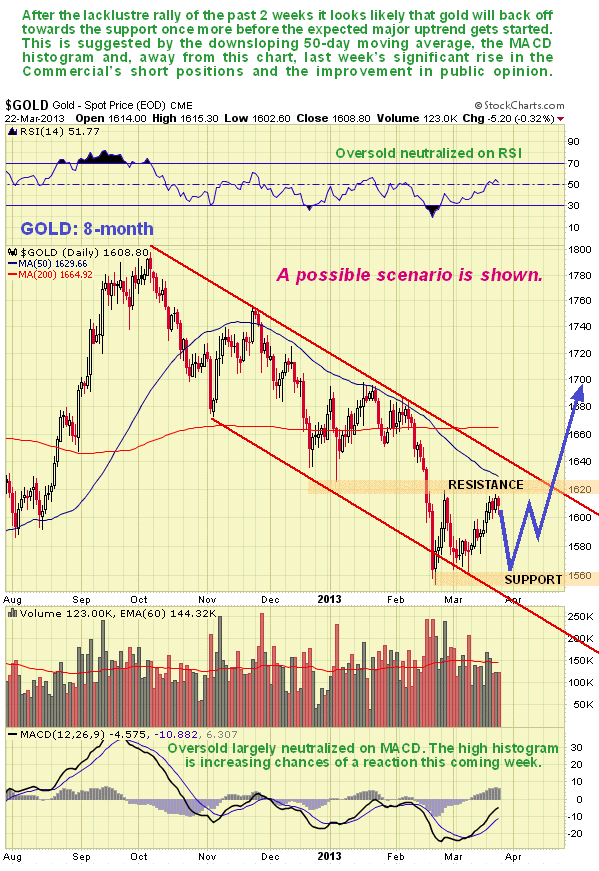
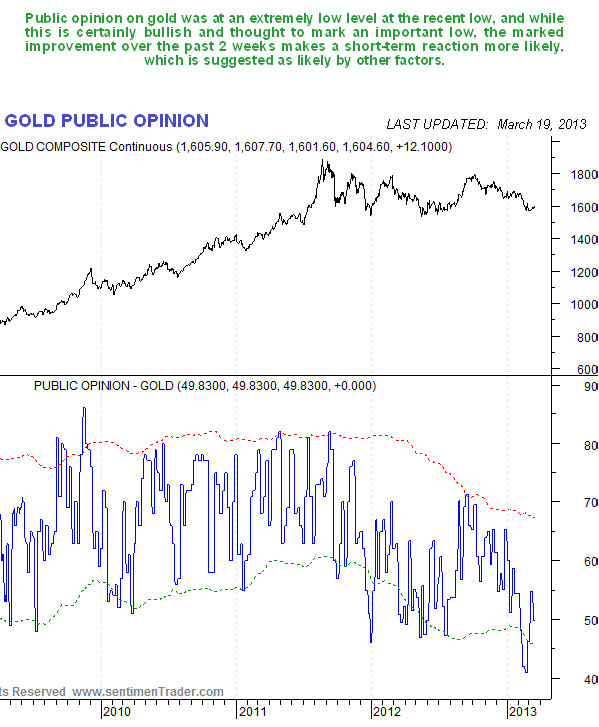
The expectation of a short-term pullback by gold before the major uptrend gets started is supported not just by the latest COT chart above but also by the latest gold Public Opinion chart, which shows a marked improvement, albeit from a very low level. This improvement has made room for a drop.
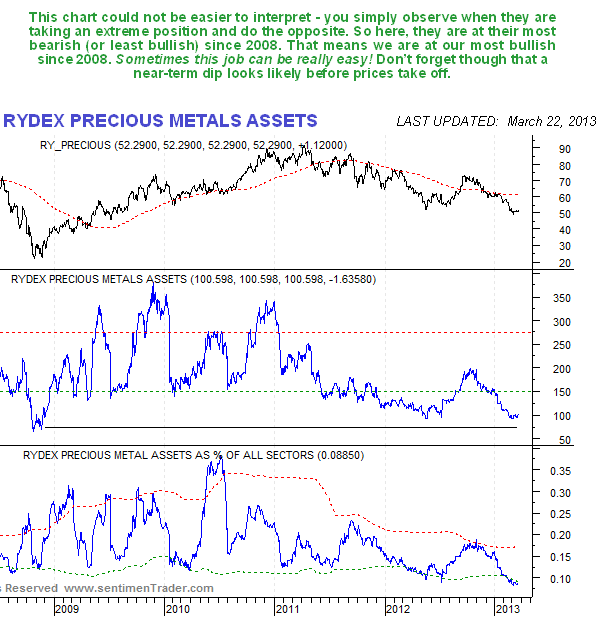
The classic contrarian indicator that frequently works like a charm, the Rydex holdings, strongly suggest that gold is at or close to a major low here.
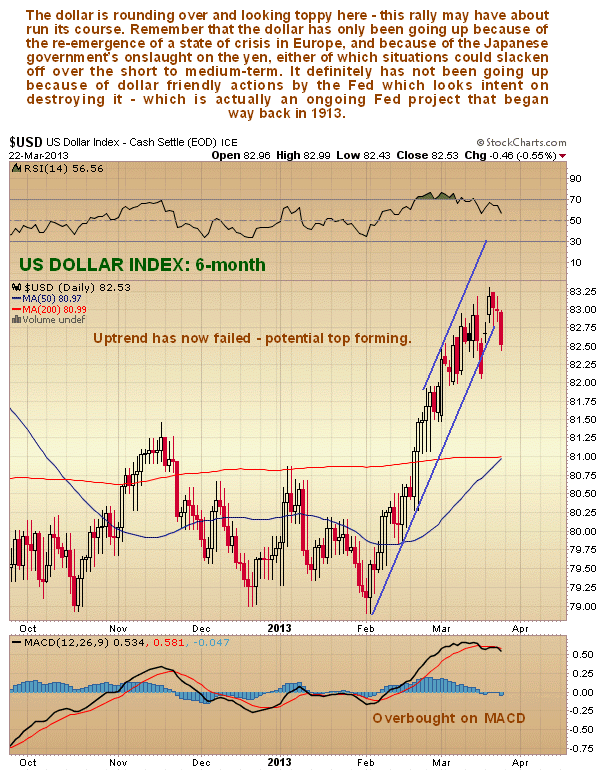
After a good run, thanks to the misfortunes of the euro and the yen, but no thanks to the Fed, the dollar is starting to look toppy here. Looking at the 6-month chart for the dollar index below, it is easy to see why gold and silver have been so weak in the recent past. The dollar has been basking in its status as 'The King of Hell', but at the end of the day it's just another fiat currency being diluted to oblivion. The Fed et 'al' have been treading a fine line, they have been happy to see the euro neutered, but don't want the European banks to collapse.
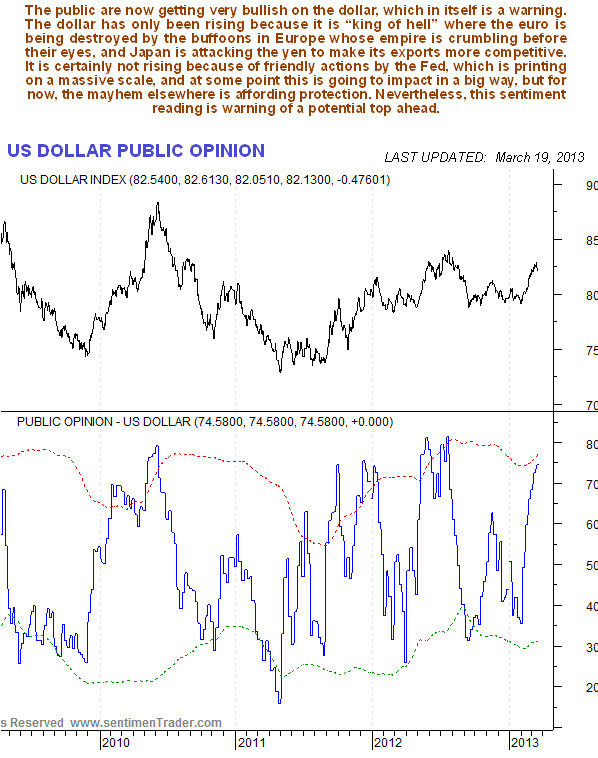
Public opinion on the dollar has become quite strongly bullish, with bullishness approaching the levels that are frequently associated with a top, so we will not be surprised to see it go into reverse soon.
Conclusion: although a short-term pullback by gold looks likely, it should be seized upon as a final buying opportunity, especially for mid and large cap PM stocks, ahead of a probable major uptrend developing soon. There is some chance that Big Money will first try to run the stops clustered below the clear and obvious line of support at $1530, in order to mop up remaining positions ahead of the big rally, but this is considered unlikely as they have squeezed most people out already. If the price did drop below this level if would be expected to be followed by a dramatic reversal to the upside.
By Clive Maund
CliveMaund.com
For billing & subscription questions: subscriptions@clivemaund.com
© 2013 Clive Maund - The above represents the opinion and analysis of Mr. Maund, based on data available to him, at the time of writing. Mr. Maunds opinions are his own, and are not a recommendation or an offer to buy or sell securities. No responsibility can be accepted for losses that may result as a consequence of trading on the basis of this analysis.
Mr. Maund is an independent analyst who receives no compensation of any kind from any groups, individuals or corporations mentioned in his reports. As trading and investing in any financial markets may involve serious risk of loss, Mr. Maund recommends that you consult with a qualified investment advisor, one licensed by appropriate regulatory agencies in your legal jurisdiction and do your own due diligence and research when making any kind of a transaction with financial ramifications.
Clive Maund Archive |
© 2005-2022 http://www.MarketOracle.co.uk - The Market Oracle is a FREE Daily Financial Markets Analysis & Forecasting online publication.


