U.S. Dollar Fiat Cliff
Currencies / US Dollar Mar 23, 2013 - 01:24 PM GMTBy: Joseph_Russo
 I would like to start this piece by recommending a rather thorough and viable chart study of the US dollar by an analyst writing under the pseudonym Rambus, titled Dollar Bears Prepare to Hibernate. Rambus has produced some excellent charts in this piece along with sound analysis, and in my view, provided readers with valuable information and insights.
It is my hope that Rambus and the readership at large will not mind if I attempt to add another layer to his cogent work.
Albeit spawning from a relatively recent and still fragile signal, at present, my work also reveals a long-term bullish bias for the dollar and a contrasting bearish bias for gold. I will endeavor to add value to the good work of Rambus using a monthly bar chart going back to 1971.

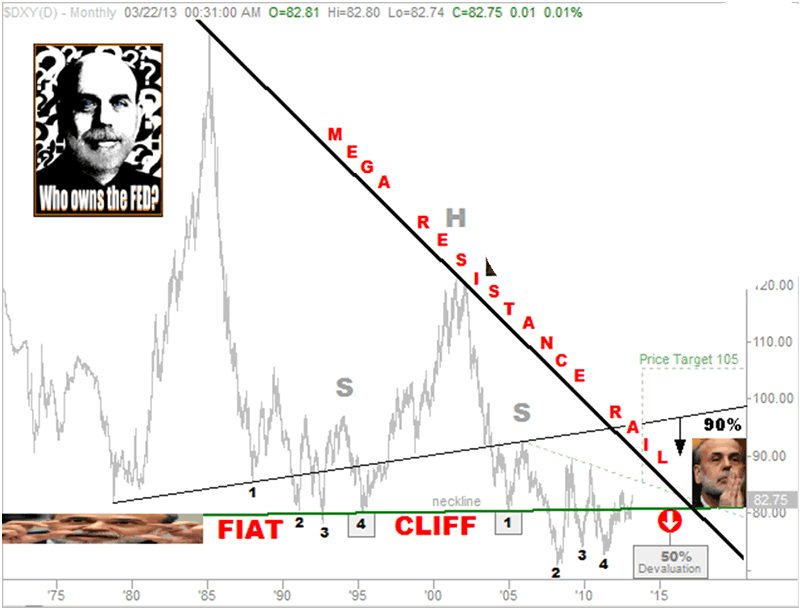
The first thing I would add relative to the big-picture monthly chart from 1981 presented by Rambus, rests specifically with regard to the H&S top mentioned. That peak occurred in 2001, and more importantly, the bearish neckline associated with it, which rests near the 80.39 level was absent from the observations he shared.
This is a critical FIAT-CLIFF bearish (neck) line in the sand, which the dollar has been struggling seriously with since July of 2007. The Dollar has traded above and below the FIAT-CLIFF for nearly six years. A wide coiling pattern akin to a rather sizable flag pattern has formed, which in this case, would imply the presence of a continuation pattern with better than fair odds for an eventual bearish resolution.
I have replicated Rambus's 4-point fractal sequence and boxed point 4 on the left, and point 1 on the right to illustrate the genesis of this major neckline. This is a line very much worth keeping a sharp eye on.
As noted in the lower right, the neckline drawn from these two points governs the active defense or suspension status of a downside price target in the low forties, which if achieved, would result in a 50% haircut from current levels.
Risk of Ruin
The final layer I wish to share surrounds what I refer to as a "risk of ruin" trajectory. When breached, risk-of-ruin-trajectories calibrate downside price targets, which for all intent and purpose virtually destroy 100% of all existing value.
Spawning from the pivot low in the late 70's and the first point labeled 1 in the late 80's, the thin rising trendline moving upward and to the right, ending just above the prayerful Ben, identifies a clear risk of ruin trajectory.
So long as the dollar maintains trade and closes beneath this rising trajectory, complete obliteration of the fiat currency to the tune of 90% from current levels, is a defended and working target. The FIAT-CLIFF line simply adds a level of immediate drama associated with the first 40% of a cataclysmic 90% wipeout.
Note how the risk of ruin trajectory twice rejected the dollars attempt to break above it upon twice approaching the rising resistance rail associated with right shoulder of the FIAT-CLIFF head and shoulder pattern.
Having said all that, until the shorter-term price action dictates otherwise, we remain bullish the dollar right alongside Rambus.
In wrapping up this view from 50,000 feet, each of us should hope and pray along with Ben for a sustainable rally to the 105 target, which would place the dollar-trade above the implied risk of ruin trajectory.
If such a bullish feat occurs, to remove the risk of ruin entirely, the dollar must never register a monthly close beneath that rising trajectory for if it does, the risk of ruin is back in play.
The Elliott Wave Take
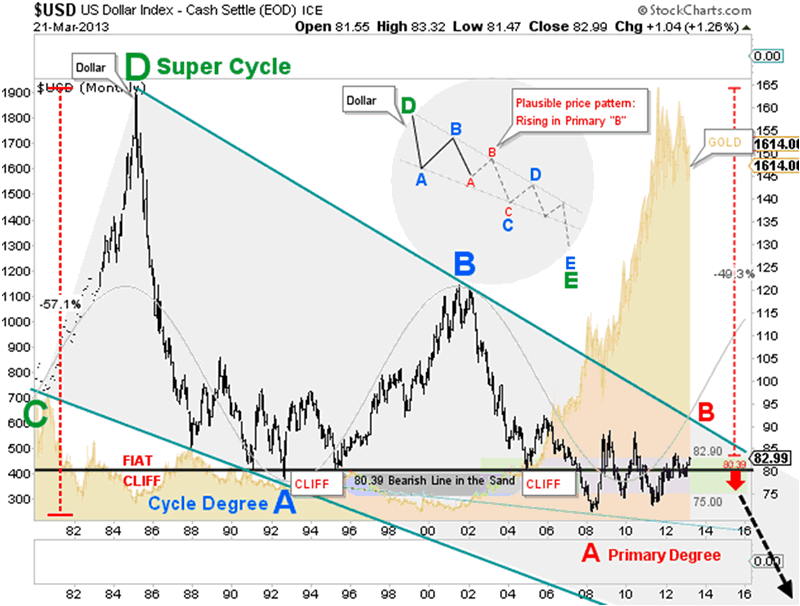
Below is a long-term chart similar to the one Rambus used from 1981. I have held to this wave count (as has the dollar) for nearly a decade. This does not imply that I will be right in the end, it simply proves that I have been right thus far.

To fully appreciate our unconventional application of the theory, specifically as it relates to the above chart, please refer to "US Dollar: Wave Counts, Flight-to-Safety" penned in June of last year.
The following is brief excerpt from the above link:
As graphically inferred by the articles introductory image, there is no doubt whatsoever that since its general inception, the US dollar remains by politically exploitive design, enmeshed in a long-term secular decline toward oblivion.
The end game will play out like those of all other fiat currency throughout humankind's history, which shall of course lead to an outright failure and the existential necessity for the country (or world) inevitably to manufacture and adopt a suitable
Trade Better/Invest Smarter
By Joseph Russo
Chief Publisher and Technical Analyst
Elliott Wave Technology
Email Author
Copyright © 2011 Elliott Wave Technology. All Rights Reserved.
Joseph Russo, presently the Publisher and Chief Market analyst for Elliott Wave Technology, has been studying Elliott Wave Theory, and the Technical Analysis of Financial Markets since 1991 and currently maintains active member status in the "Market Technicians Association." Joe continues to expand his body of knowledge through the MTA's accredited CMT program.
Joseph Russo Archive |
© 2005-2022 http://www.MarketOracle.co.uk - The Market Oracle is a FREE Daily Financial Markets Analysis & Forecasting online publication.


