Is Japan's Economy Heading for Endgame, Nature of Deflation
Economics / Japan Economy Mar 20, 2013 - 09:36 AM GMTBy: Sam_Chee_Kong
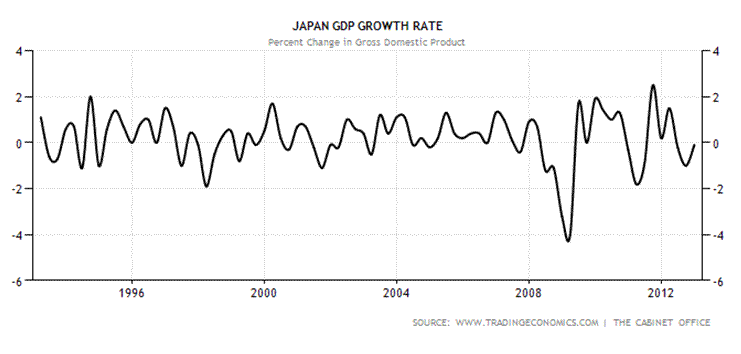
 Newly elected Japanese Prime Minister Shinzo Abe has promised to boost the Japanese economy by unlimited stimulus and increased government intervention in the financial market. The Japanese economy has been bogged down by lucklustre economic growth which can be shown by the following GDP Growth chart from 1993-2013.
Chart 1 – 20 years GDP Growth Rate
Before we delved into the current deflationary problem that is haunting the Japanese economy for the past decade it is best to gain some knowledge of its origin.
Nature of current Deflation
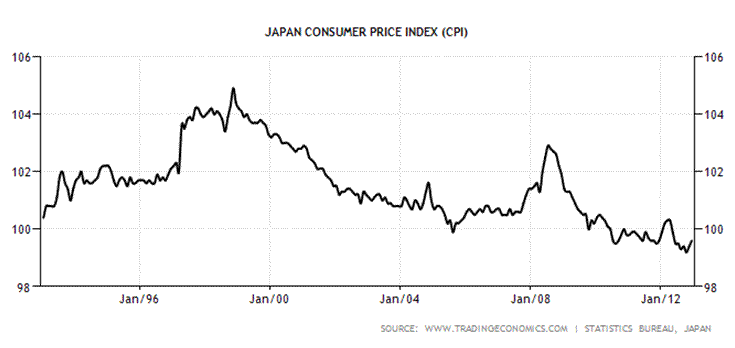
As a result of the boom years from 1980s to early 1990s the inflation rate had been creeping up and reached its peak in 1998 with the CPI reaching 104.8 index points. It had reached a point where it affected both the consumers spending and the corporations. Consequently the Bank of Japan pledged to rein in prices. In 1998 the Bank of Japan made it known that its main objective is to achieve price stability and one such monetary tool to achieve this goal is to have a zero interest rate policy (ZIRP). By implementing ZIRP it hoped to bring some stabilty to the price level. In fact as the years went by prices instead trended downwards as evident from Chart 2 below. When the anti inflationary measures was launched in 1998 the CPI reading was at 105 index points but then prices kept falling until it reaches 99.6 index points in December 2012. Various attempts by the Bank of Japan to end the deflationary Japanese economy seems to be getting nowhere.
Chart 2 – 20 years CPI figures
Instead of being a short term objective to stabilize the price level but without a reflation policy in place to restore the price level prior to the deflation episode it resulted in a price decline that prolong till recently. Deflation by definition means falling prices and in the long run this would have profound effects on both consumers and corporations. For consumers it will increase their expectation for further price decline and hence they will spend less and save more which is detrimental to any economy. On the other hand corporation’s profits will be further squeezed by falling good,services and assets prices and hence will also dampen their spirit to increase their investment spending. If this were to go on any longer Japan will find it more difficult to extract itself from the current deflation.
For an economy to move forward it needed to have a moderate level of inflation preferably slightly above zero percent. When the economy starts reflating prices of goods, services and assets will be appreciating and this will help change the pessimistic outlook of both the consumers and corporations towards the economy. Without public intervention to change the overall outlook of the economy Japan will not succeed in its endeavour. Therefore to change the existing mood of the economy the government can either increase the inflation or price level expectations. By increasing inflation expectation we mean by setting a certain percentage say (1-2%) on future targeted inflation rate. Similarly the increasing the price level expectations refers to increasing the index points level on the CPI index. Say for example as of December 2012 the CPI index point level is at 99.6 the government can announce its future target for the CPI index point to 102. In such an event it will help diminish any negative expectation or uncertainty towards the financial market and hence the economy.
Coming back to Present
As can be seen from Chart 1 above, the GDP growth rate has been stagnant and oscillating between +2% and -4% over the entire 20 years period. This deflationary problem has taken its toll on both consumers and corporations because as a result of this they are paying more yen for their debts. Moreover as of late the Japanese economy is encountering some strong economic headwinds which resulted in its exports and balance of trade to plummet. The drop in its exports are due to the following.
- Strong Japanese Yen (JPY/USD – 80)
- Slowdown of Global demand
- Territorial dispute with China resulted in boycott of Japanese goods
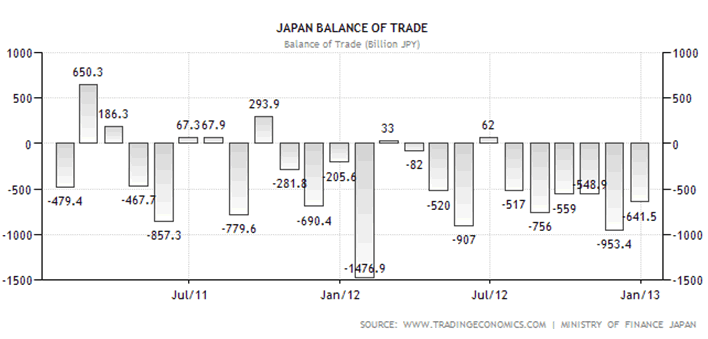
The following are the charts of the Japanese Exports and Balance of Trade. As evidently the exports plummet from the high of ¥6204 billion in April to ¥5300 billion in December 2012. In addition from Chart 4 below, in December 2012 Japan also recorded a trade deficit of ¥641 billion. According to the Ministry of Finance exports fell 5.8% while imports increased 1.9% in the same period. For the year of 2012 in totality Japan recorded a trade deficit of ¥6.927 trillion ($78.24 billion).
Chart 3 – Japan exports
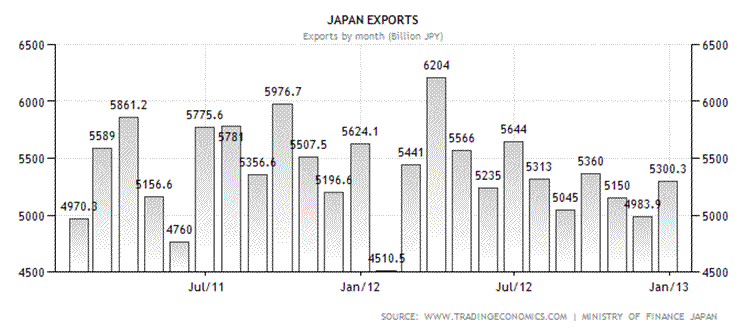
Chart 4 – Balance of Trade
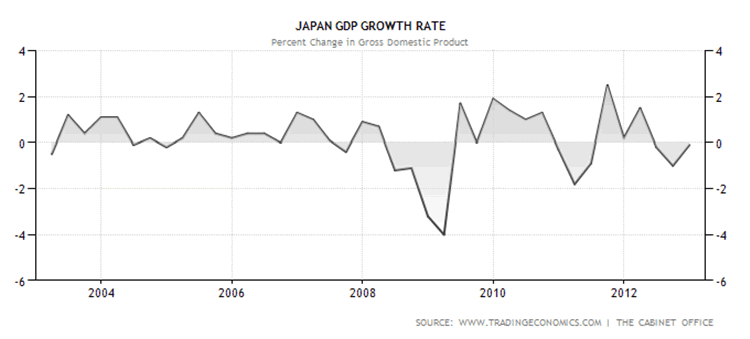
Further to this the Japanese economy found it very difficult to divorce itself from the current recession. One of the main reasons for this difficulty is that most Japanese people and its corporate followed the traditional savings mentality. Money saved and not spend meant that there will be negative consequences on the velocity of money and hence the multiplier effect on the economic activity. The following chart shows Japan’s GDP Growth rate for the past 10 years. Notice that since 2008 there have been three periods of negative growth during 2009, 2011 and 2012 which is also known as triple-dip recession. During the last quarter of 2012 the GDP contracted by 0.10 % which means it still unable to drag itself out of the current triple-dip recession.
Chart 5 – GDP Growth rate plotted in Area form
Shinzo Abe’s Reflationary Policy
Despite several rounds of Quantitative Easing however its effects is no longer effective in persuading the Japanese consumers to spend more and hence as a result does not produce any meaningful result from the multiplier effect. From previous experience in the 1930s the Finance Minister of Japan then Korekiyo Takahashi managed to rescue Japan from the grip of the Great Depression by using Reflationary policies which also resulted in a record turnaround of its economy. Korekiyo implemented the following policies as part of his reflationary effort.
- Took Japan off the Gold standard and allow the ¥ to float.
- Outlaw the conversion of paper currency to Gold
- Slash interest rates
- Enshrine BOJ to buy and warehouse bonds for future sales
- Embark on massive Government spending
Korekiyo’s policies are immensely successful and the end result is the stock market tripled, ¥ devalued by 40% and exports boomed and for the next 5 years Japan’s economy grew at an average rate of 6.5%.
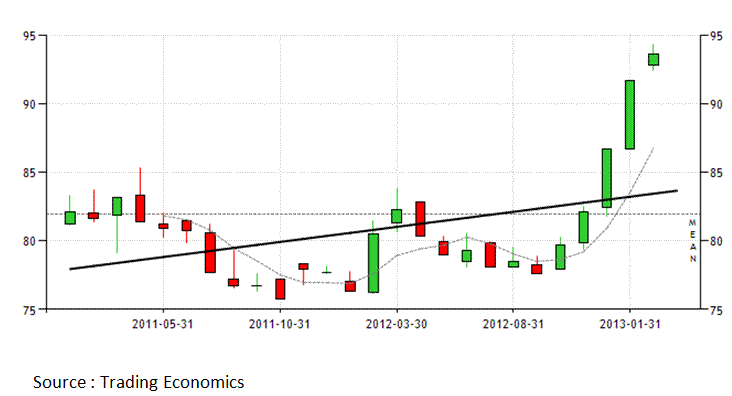
Currently the Japanese Government under Abe is also trying to rescue its economy from the current deflationary grip by employing the same strategy used during the 1930s which is to reflate the economy. By reflating we mean the government trying to achieve inflation rate higher than the normal long term rate so as to restore price level to pre deflationary level and in this case before 1998.Recently the Japanese government announced its objective of achieving an inflation target of 2% at any cost. The Bank of Japan is committed to buy into the Bonds and Equities market. Following the Bank of Japan’s intervention in the bond market the Yen fell to a seven month low. As of late the Yen had depreciated about 20% falling from 78 to 94 to the dollar. The following chart shows the performance of the Yen against the US$.
Chart 6 – JPY/USD
Side effects of Reflation
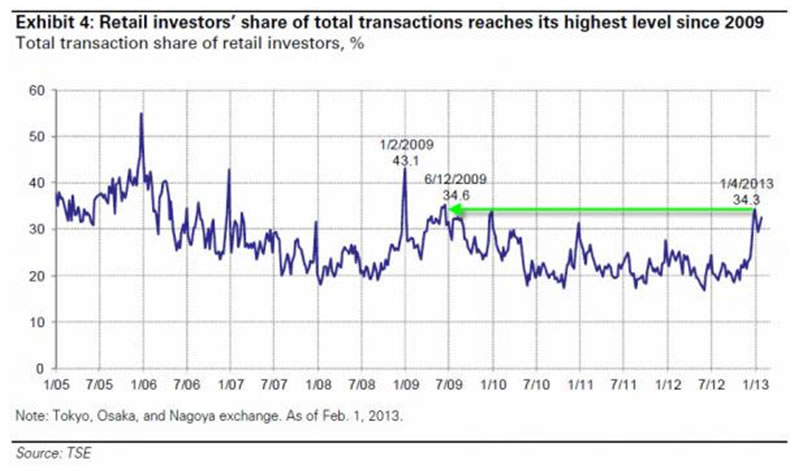
Thanks to Mr Abe’s reflationary policy which resulted in the current run up of the Nikkei 225. The good news is that since Abe’s inauguration on 16th December 2012, the Nikkei has soared by more than 1000 points. The bad news is that we doubt the current run up will be sustainable for the long term. One of the indicator is the retail investor’s share of total transactions reaches its highest level of 34.3% (refer to Chart 7 below) since 2009. According to the Tokyo Stock Exchange the combine trading value of the seven largest internet brokers totalled ¥19.5 trillion in January 2013 which represents an increase of 86% over the month of December 2012. One of the main drivers of the stock market is liquidity. When everybody is ‘Fully Invested’ where will the extra liquidity be coming from to sustain the market? Or we can put it another way, the Japanese retail investors are fully leveraged and any dip in the Nikkei will result in a panic sales of equities. That is why in some days the Nikkei has been trading over a very wide band (±100 points) for the past month.
Chart 7 – Retail investors in Tokyo Stock Exchange
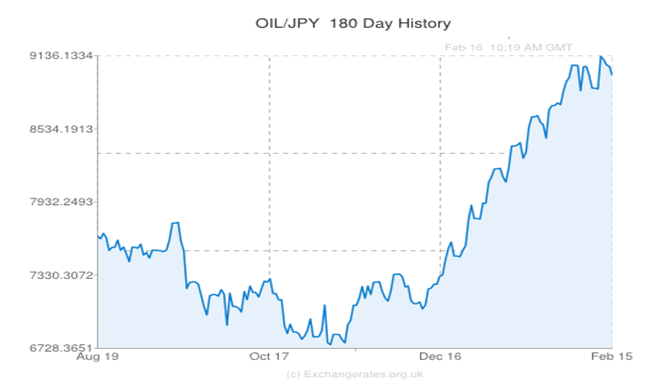
Another side effect of Abe’s reflationary policy will be the inflationary effects on goods and services. As a result of the current monetary policy that weakens the ¥ that means imports will be more expensive and exports will be cheaper. The increase earnings in exports will be sterilized by the increasing cost of the imports especially from oil. Japan is not an oil producing nation and virtually all of its oil needs are imported which resulted in its economy being very sensitive to any oil price shock. Any oil price shock will render its economy to a recession and with the current ¥ price of oil moved from ¥6728 on October 2012 to ¥8973 (chart below) on 15th February 2013 we believe there will be repercussions that has yet to be price in. The chart below shows the 180 day oil price quoted in Japanese Yen.
Chart 8 – 180 days Oil/JPY
The third side effect of inflation will be the effects on bond yields. As a result of inflation investors will need a higher yield to compensate for the loss of purchasing power due to inflation. As we know interest rate is a very delicate and sensitive element in the Japanese economy. The problem lies with the JGPIF (Japanese Government Pension Investment Fund) where ordinary Japanese contributed to the fund for their retirement. This scheme is quite similar to the EPF and CPF in Malaysia and Singapore where both employer and employees contribute a certain amount of their salaries towards the fund every month. JGPIF is the world’s largest pension fund and worth about ¥108 trillion.
It has the obligation to pay about 5.9% in interest to its members this year which amounts to about ¥6.4 trillion. That means that JGPIF will need to achieve an investment return of more than 5.9%. With such a massive fund it would be a monumental task and any return from fixed income investments will be negligible since the official interest rate is zero. It will be force to invest into riskier investments like the stock market. As we have mentioned above the Nikkei 225 is already reaching a plateau and any severe correction in the index will have big repercussions on its earnings. Again since the official interest rate is zero how are they going to finance the obligation to pay out the ¥6.4 trillion? What the JGPIF has been doing for the past few years is ‘self-liquidating’. By this it means it is selling its bonds to finance its payout. The following graph shows the extend of the self-liquidating effects on its assets.
Chart 9 – Japanese Government Pension Investment Fund
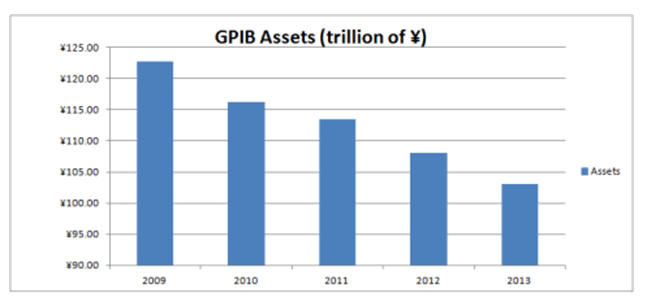
One picture tells a thousand words. As more assets are sold there will be less available to earn interest. To compound the problem as we have mentioned earlier with the government’s targeting the inflation rate of 2%, we doubt those members will be sitting still. They will be demanding higher interest rates so as to compensate for the 2% increase in the inflation rate. Given that the current nominal interest they are receiving is 5.9%, the real interest rate they will be receiving in future is 3.9% after inflation (5.9% - 2%). If JGPIF were to oblige to the higher interest rate payment in future, where will be the additional monies coming from?
The fourth side effect is it will dampen the Japanese authority’s ability to raise funds locally through the bond market in future. As can be seen from above the implementation of the 2% inflation target will meant that bondholders will be getting a negative return on their investments. This will force the traditional Japanese investors to seek higher returns and hence transfer their savings in banks and bonds to the stock market. From the above chart the total share of retail investor’s participation in the stock market increased to 34.3% in January which is almost the same rate set back in July 2009. So when the retail investors ‘are all in’ then obviously there will not be any more funds available to invest. So for future fund raising the Japanese Government will have to look elsewhere most probably in the international market. Currently the locals represent about 90% of the bondholders and the rest being foreign investors nevertheless this composition will change very soon in the future. Borrowing from the international market not only means paying higher interest rates but also represents a form of leakage in the economy when they repatriate the interest payment back home. Hence this will further burden the economy in the future as more debts will be created. In totality the total debts held the Japanese Government, household and corporations are more than 500% of GDP.
Can the Nikkei 225 sustain?
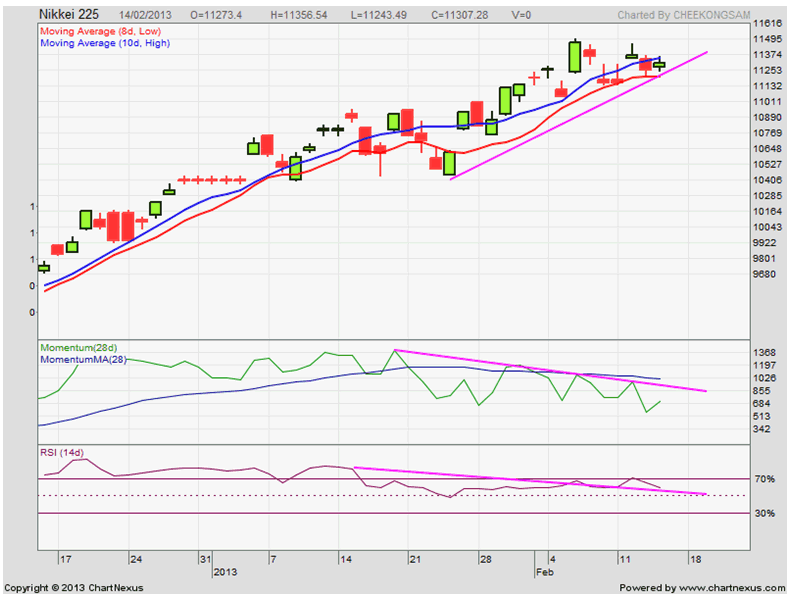
We reckoned that the Nikkei endgame will not be very far off as we shall show you the following chart. Below we present to you the Nikkei 225 daily chart. One thing which is very obvious is that there is already a Divergence between the price and indicators. That shows that the trend is weakening and about to turn. It is indicated by the pink line.
Chart 10 – Nikkei 225
The full extent of Japan’s reflationary policy is yet to be seen. Whether it will result in an Endgame of the Japanese economy will also need to be seen. We doubt Abe’s reflationary policies will have the same effect as his predecessor’s in the 1930s because then,
- The world was not so globalized
- Japan was not so indebted
- The role of oil is not that significant to the Japanese economy
- There was massive government spending on the military before WWII
- Not many countries (except U.S) engaged in Quantitative Easing, Competitive Currency Devaluation and Deficit Spending
At this juncture we reckoned that the first salvo of Currency wars had already been fired. While most of the Central Banks around the world still indecisive on whether to devalue their currencies, Venezuela on February 13 2013 devalues its currency by 46%. This is the fifth devaluation in a decade and the new rate for the bolivars to be set at 6.30 from the previous 4.30 to the dollar. How all these will manifest into the future will be an interesting episode as we believe that many countries will not wait for long to join in this currency devaluation bandwagon. As empirical evidence shows that those countries that devalues first will be the ‘early bird gets the worm’.
by Sam Chee Kong
cheekongsam@yahoo.com
© 2013 Copyright Sam Chee Kong - All Rights Reserved
Disclaimer: The above is a matter of opinion provided for general information purposes only and is not intended as investment advice. Information and analysis above are derived from sources and utilising methods believed to be reliable, but we cannot accept responsibility for any losses you may incur as a result of this analysis. Individuals should consult with their personal financial advisors.
© 2005-2022 http://www.MarketOracle.co.uk - The Market Oracle is a FREE Daily Financial Markets Analysis & Forecasting online publication.


