Stock Market Indices v Individual Stocks - Hold/Sell?
Companies / Company Chart Analysis Mar 11, 2013 - 08:22 AM GMTBy: Michael_Noonan
 Few actually invest in an index, like the Dow, S&P, NASDAQ, etc. Most have individual stocks that may or may not be a component, yet what everyone hears about are how the various indices performed. "The Dow was up/down 80 points, today." "The S&P is near all-time highs." The more pertinent question is, where is/are your stock[s] relative to the market? If the indices are up but your stocks are down or not up by much, what does that say about your portfolio?
Where the Dow and S&P are at/nearing historic highs, does that mean you should be long the stocks in your portfolio? Because charts do not lie, we decided to look at individual stocks to determine if one should buy/hold/sell them. Which stocks? Warren Buffett is purported to be a market "oracle," before he joined the Dark Side. Six of his stocks were in the news last week, so we looked at three of the best performers. Then, we randomly selected several more for an unscientfic grouping.
What little we know about stocks is irrelevant because we know how to read charts, and charts reveal what ALL participants are doing, from the most informed with the best and most expensive research, to everyone else making a decision to buy or sell. We also know that many investors overstay their positions. That may come from the fact that Wall Street analysts are loath to issue "sell" signals for fear of losing their jobs, even though it may mean investors are losing a lot of their money.
Here is a look at 3 of Buffet's holdings and then a few other recent top performers.
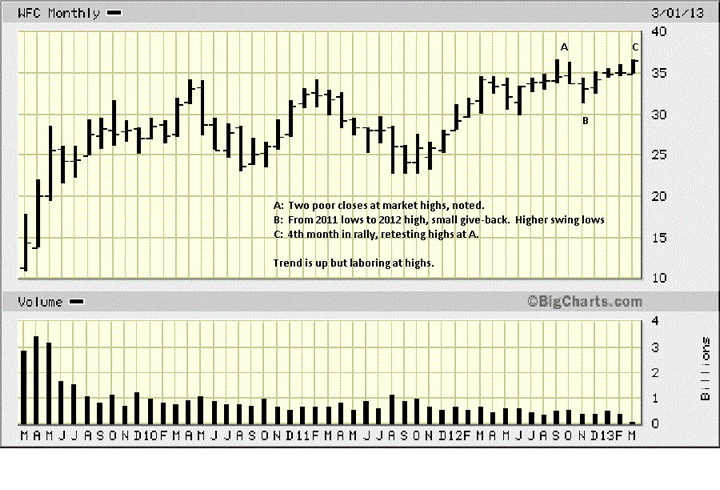
Wells Fargo Company, [NYSE], has been laboring to go higher during the past three years. Where indices are at their highest levels in recent years, WFC is not performing very well, and it is at resistance.
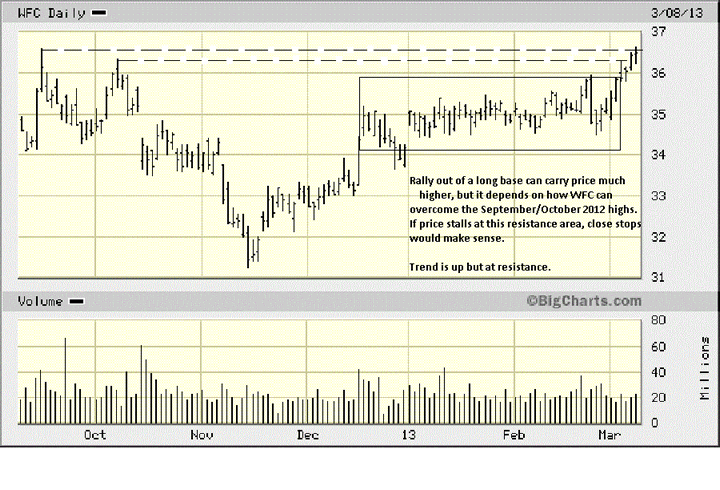
The daily gives a clearer picture. The last two bars are overlapping at a resistance point. If price cannot get above the 36.50 area on strong volume and upside activity, this may be the best WFC can do. One would want to be defensive, if long.
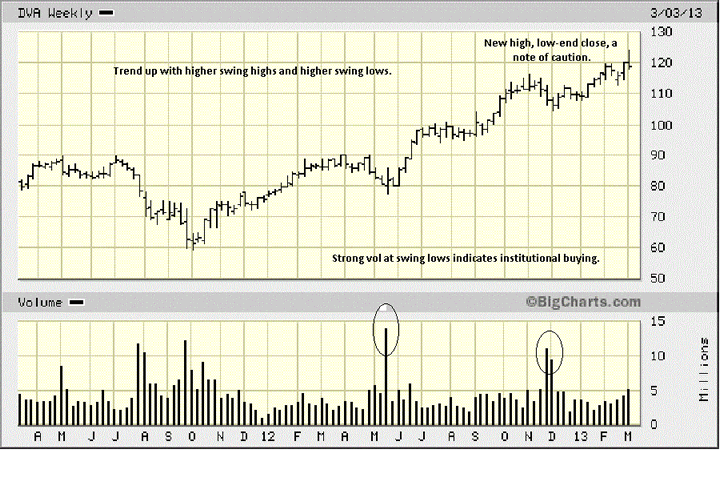
DaVita Healthcare Partners, [NYSE], is a trending market with higher swing highs and higher swing lows. Last week's performance raises a red flag with a new high, increased volume, but a lower close. At new highs, sellers were stronger than buyers, and the net swing high gain is not much since last November's swing high.
The high volume weeks reflect strong buyers, but one needs to be just a little wary, here.
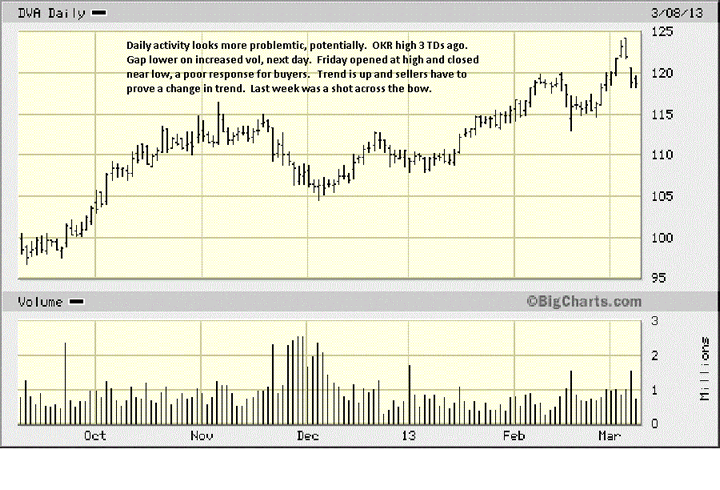
A look at the daily shows why the weekly chart raises a red flag. The high, 3 trading days ago, was an Outside Key Reversal, [OKR], a new high, a lower low, relative to the previous day, and a low-end close. The developing market activity is telling us sellers overwhelmed buyers and took control.
This factual observation is confirmed next day when price gaps down on sharply higher volume. Friday's small range is the market's way of letting us know that the response from buyers was weak. With indices doing much better, this could be a stand aside for longs, purely based on observing market behavior.
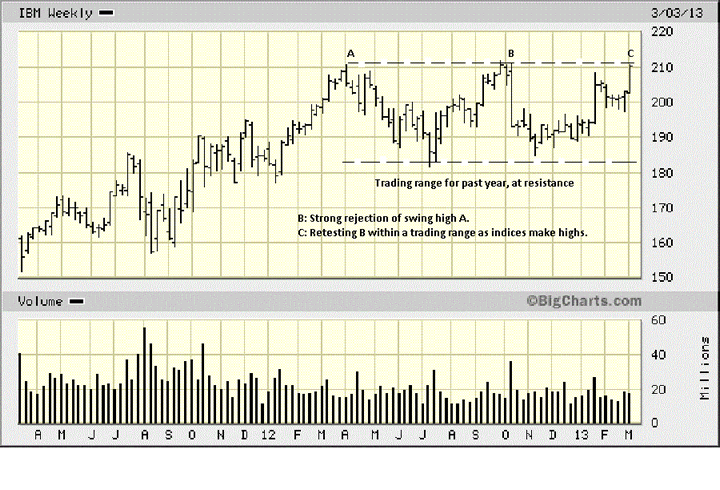
IBM, [NYSE[, an old stand-by, and it is showing its age. While indices have rallied well over the past year, IBM can only move sideways. Can it go higher? Yes. Will it? That is a more pertinent question. Point "B" failed big time when it retested swing high "A." Right now, "C" is retesting the upper resistance level. How is it faring on the daily?
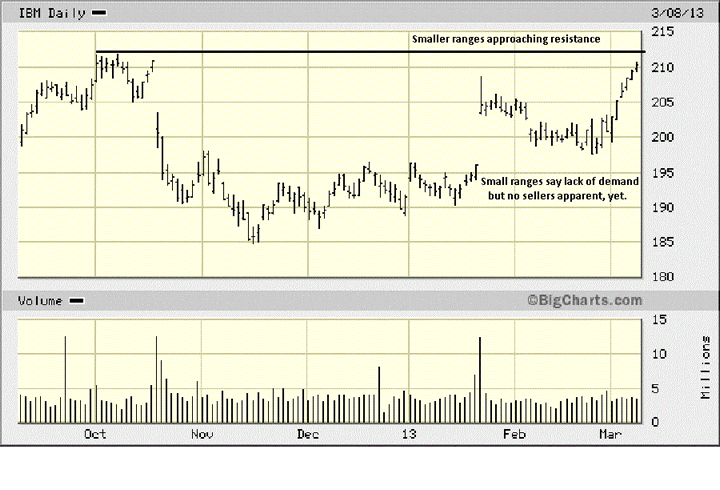
The smaller daily ranges are the market's way of showing that demand is weak, otherwise, the ranges would be larger. Sellers have not stepped in, but they could be waiting for the rally to go just a touch higher. How price reacts to the 212 area will be an important tell for IBM's future. If it continues higher, fine. If not, the market is sending a message.
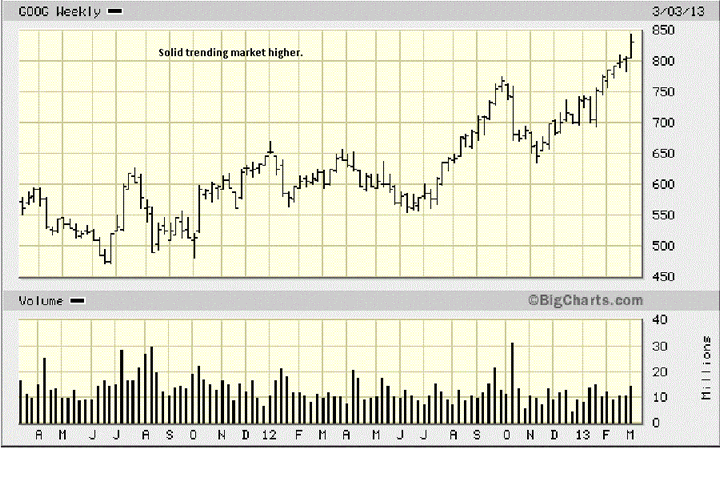
Ubiquitous GOOGLE, [Nas], is a market in an obvious up trend showing no signs of any weakness. This is a market leading the NAS index.
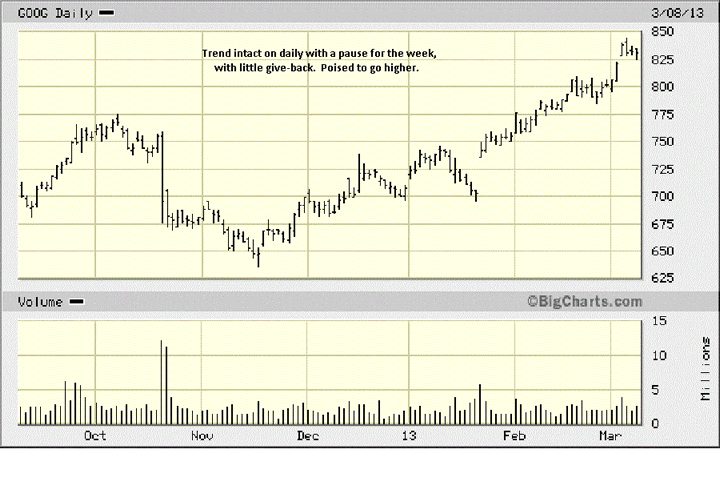
Smaller ranges are not necessarily bad, as long as they maintain upward momentum, and what corrections there are, are relatively small, like the end of February and last week. When you compare GOOG with the first three stocks, you can see how well a strong price move leaves little guesswork about being long, or not.
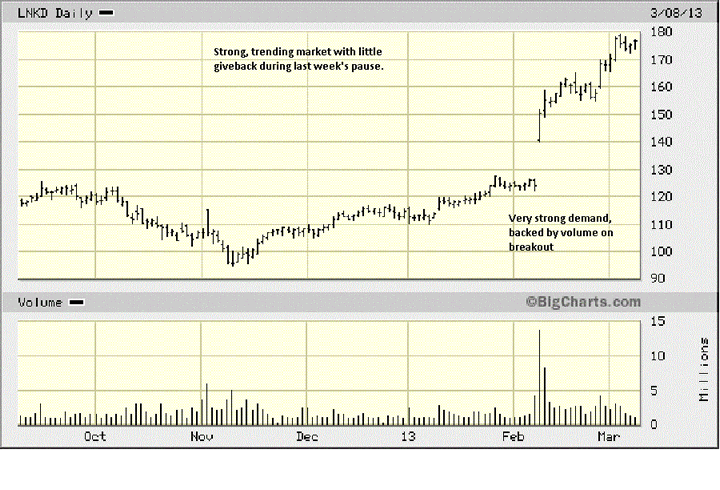
LinkedIn Corp, [NYSE], is another stock that is not sending mixed signals or raising red flags. Developing market activity is telling anyone watching that this market is healthy.
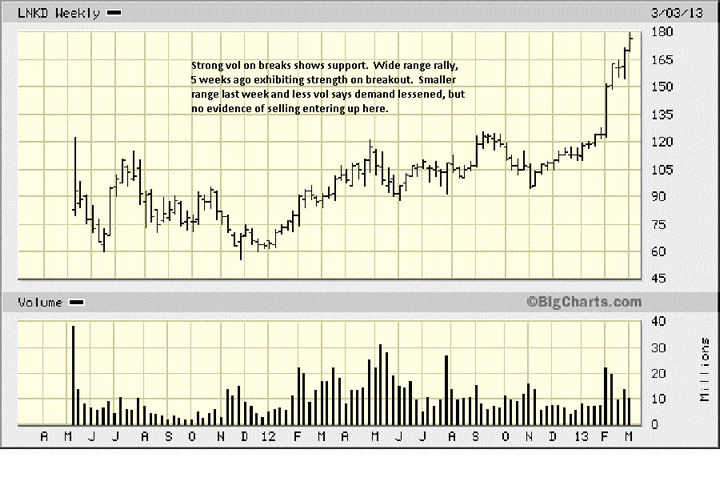
All one has to do is observe the corrections since the strong breakout, last month. There is very little give-back, telling us buyers are in control, very much in control. Also note that very little need be said when a stock is doing so well relative to the rest of the market.
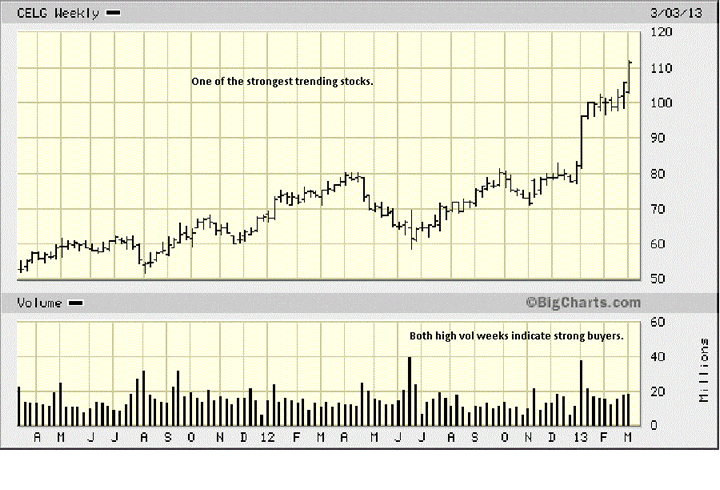
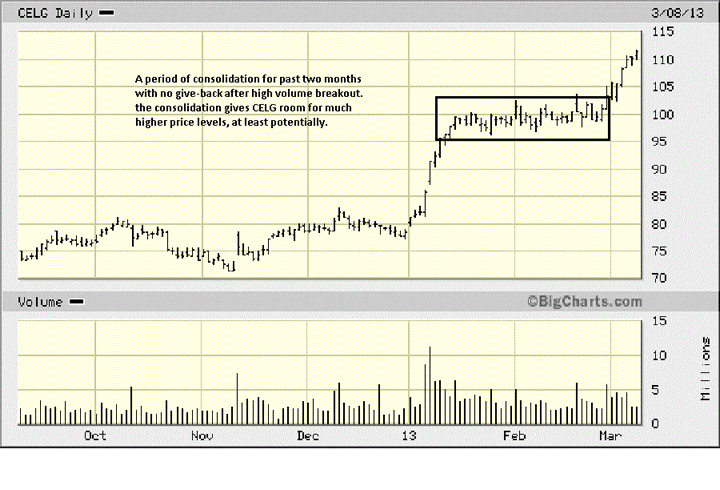
Celgene Corp, [NAS], is probably the strongest of the group. All we are doing is looking at individual stocks as they compare to the various indices from which they came. Last week was an impressive one: a wide range and strong close.
It is interesting that some of the stronger markets are NAS stocks, the weakest index, relative to the S&P, and DOW. The NAS has been struggling to recover the 50% retracement of its range from the 2000 high to 2002 low.
What this little exercise does is put an individual stock as measured against an index to see how it is performing. One can look, and within a few minutes make a determination about the overall condition of a stock as a candidate to be held, like the last three stocks, when compared to the relative performance of the first three.
What we did not do is show any stocks that are near their lows or well under 50% of their last year's range. Those stocks do not belong in one's portfolio, and if anyone has any, well, that ship has sailed, not to sound callous, but the market gave signs of weakness a long time ago, and if one chooses to ignore them, the lessons can be expensive.
[We can do a multi-time frame chart analysis of a stock, for a fee, if anyone is interested.] [mn@edgetraderplus.com]
A mistake many make, when assessing a poorer performing stock is to see how the market is rallying, overall, and then "hoping" that stock will "catch up." Markets do not work that way. This is an easier way to make a factual assessment based on what the market has to say about a stock you may own. It takes away the emotional element of being tied to a decision made that may not be doing all that well.
One thing about the market, it never lies.
By Michael Noonan
Michael Noonan, mn@edgetraderplus.com, is a Chicago-based trader with over 30 years in the business. His sole approach to analysis is derived from developing market pattern behavior, found in the form of Price, Volume, and Time, and it is generated from the best source possible, the market itself.
© 2013 Copyright Michael Noonan - All Rights Reserved Disclaimer: The above is a matter of opinion provided for general information purposes only and is not intended as investment advice. Information and analysis above are derived from sources and utilising methods believed to be reliable, but we cannot accept responsibility for any losses you may incur as a result of this analysis. Individuals should consult with their personal financial advisors.
Michael Noonan Archive |
© 2005-2022 http://www.MarketOracle.co.uk - The Market Oracle is a FREE Daily Financial Markets Analysis & Forecasting online publication.


