


Stock Market Uptrend Nearing High
Stock-Markets / Stock Markets 2013 Mar 09, 2013 - 05:42 PM GMTBy: Tony_Caldaro

 Just when the negatives started to build the US market ignored it all and continued the uptrend. The SPX made a new bull market high, and the DOW, the DOW made a new all time high. This was quite amazing, as at the time 70% of the world’s indices were in downtrends. For the week the SPX/DOW gained 2.20%, and the NDX/NAZ gained 2.25%. Asian markets gained 2.3%, European markets gained 2.5%, and the DJ World index gained 1.8%. On the economic front positive reports continued to outpace negative reports. On the uptick: ISM services, the ADP index, consumer credit, the payrolls report, wholesales inventories, the monetary base, long term investor sentiment, and both the weekly jobless claims and the unemployment rate improved. On the downtick: factory orders, the trade deficit and the WLEI. Next week, options expiration week, we get retail sales, industrial production, and the CPI/PPI. Best to your week!
LONG TERM
This week the DOW responded to all the bear market rally technicians/fundamentalists with an all time new high. This event, over 100% above the March 2009 low, should end that debate. Using OEW analysis we first turned somewhat bullish, expecting a rally to SPX 1150, a few days after the March 2009 low. When the market reached that level in January 2010, and corrected in an abc pattern into February, we turned long term bullish. We have remained long term bullish ever since. Except for a couple of inflection points, along the way, when we turned long term neutral for a week. Not surprisingly, that week was often the low.
Our weekly chart continues to display the wave pattern of this anticipated Cycle wave [1] bull market. During bull markets Cycle waves unfold in five Primary waves. Primary waves I and II completed in 2011, and Primary III has been underway since that low. Primary wave I divided into five Major waves with a subdivding Major wave 1. Primary wave III is also doing something similar, but both Major waves 1 and 3 are subdividing. Major waves 1 and 2 of Primary III completed in 2012, and Major wave 3 has been underway since that low. Within Major wave 3, Intermediate waves i and ii completed in late 2012 and the current uptrend is Intermediate wave iii.
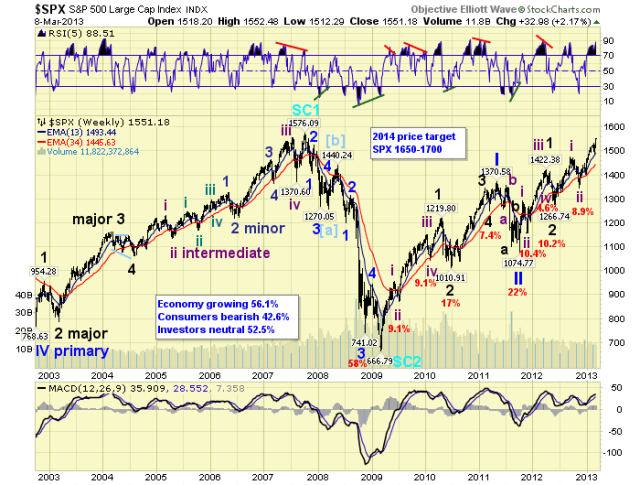
Our original bull market target was for the market to near/reach the previous all time high by 2013. In the DOW, the US stock market bellwether, it was achieved this week. Also, the SPX has already reached our minimum upside target range of 1536-1556. Considering the wave structure, the Time Cycle analysis below, and taking into account QE 3, we are now raising the upside target to SPX 1650-1700 by Q1 of 2014. Details below.
TIME CYCLES
This week the DOW broke out to all time new highs in a perfect wave location: Int. iii of Major 3 of Primary III, or 3 of 3 of 3. For comparison purposes we took a look at the last ‘breakout to all time highs’ in 2006. We then adjusted the wave count of that bull market as if it too were a Cycle wave. Under that wave count the previous ‘breakout’ was also at Int. iii of Major 3 of Primary III. A perfect fit, but there is more.
During the 2002-2007 bull market it took exactly 48 months of bull market activity before the breakout occurred. Then the market topped exactly 12 months later. That bull market began in Oct02, broke out in Oct06, and topped in Oct07. This 2009-2013 bull market has also taken exactly 48 months before the ‘breakout’. The bull began in Mar09, broke out Mar13, which now suggests a bull market top in Mar14.
Following this theme: breakout to new highs – then top within twelve months. We checked further back into market history and noticed the following. After the 1998 crisis the DOW made new all time highs in Jan99, then topped in Jan00. After the 1987 crash the DOW made new all time highs in Aug89, then topped in July90. There is definitely a time/price pattern at work here.
Adding to this probability is the potential for an upcoming recession, using the irregular presidental recession cycle. Since 1949 there have been eleven recessions. Three occurred in an election year, at the end of a president’s term. But eight occurred within 18 months after a new/second term president was sworn in. President Obama was sworn in January 2013.
If we now make the assumption that the bull market high will occur in Feb/Mar14 to complete Cycle [1]. This five year bull market will have matched, in time, the five year bull of the previous Cycle wave [1]: 1932-1937. It will have also matched, in time, the previous bull market: 2002-2007. Then, however, the market enters a new treacherous bear market period: Cycle wave [2].
After the last Cycle [1] 1932-1937, Cycle [2] dropped 49% in 12 months into 1938. Cycle [2] should have ended there with that percentage of decline. Cycle waves generate about a 50% market correction. After a big bullish looking rally into 1939, Germany invaded Poland and the market eventually went back to the 1938 lows by 1942. Cycle [2] should have lasted 1 year (12 months). This would have been similar to Cycle [4] which also lasted 1 year, 1973-1974 (21 months). The percentage of decline is important, not the time, as we recently observed in the 2 year, Oct07-Mar09, (17 month), 54% decline.
The next thing of interest is the presidential 4 year cycle, which typically bottoms in the months Mar/Jly/Oct. It has a pretty good record: 1982, 86, 90, 94, 98 and 2002. But occassionally it gets out of sync. In example: 2006, 2010, and soon 2014. When this occurs it eventually realigns, sometimes rather quickly. For example: 1946 made a high then a mini crash followed into the 4-year low, 1962 made a high and a mini crash followed, and 1990 made a high then a mini crash followed.
Finally, with about a 50% market loss expected for Cycle [2], the 4 year low potentially bottoming in 2014, and possibly a Secular cycle low as well. We looked back in market history for huge declines during a short period of time. We found two historical periods of huge declines, bonafide crashes, in just two months: 1929 -48%, and 1987 -35%. The 1929 crash, was a straight down one downtrend event. The 1987 crash was an unusual five wave/trend elongated flat event. Primary wave II, during this bull market, duplicated that pattern during its 19% decline. An omen of things to come?
With high frequency trading, long term rates heading higher, and the USD in a bull market. There is now the potential for a bull market high in Feb/Mar14, then a bonafide market crash during 2014. This is just another example of investor mass psychology patterns in action: past, present and future.
MEDIUM TERM: new uptrend high SPX 1552
This uptrend, Intermediate wave iii, began in November at SPX 1343. It has risen 209 SPX points in four months, equalling the rise of the four month rise of the previous uptrend, Intermediate wave i (208 points). We have been labeling this uptrend as five Minor waves. Minor 1 to SPX 1424, and irregular Minor 2 flat to SPX 1398-1448-1398, Minor 3 to SPX 1531, Minor 4 to SPX 1485, and Minor wave 5 underway.
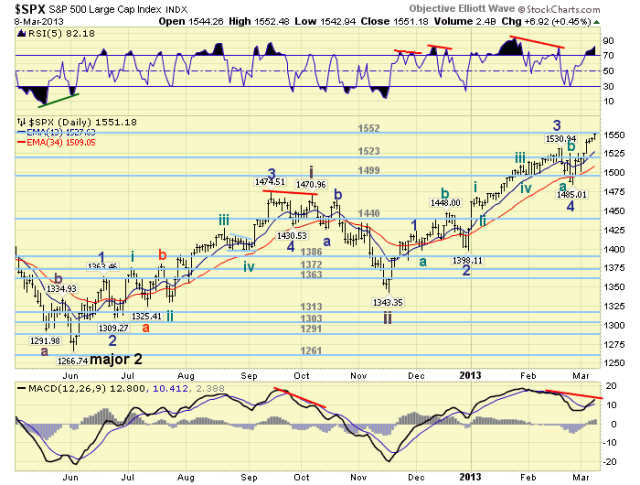
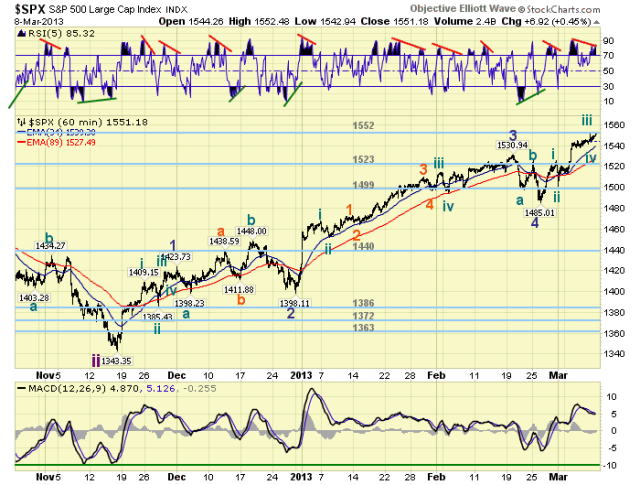
Within each of these Minor waves we have labeled five Minute waves. During Minor wave 5: Minute i SPX 1525, Minute ii SPX 1501, Minute iii SPX 1552, Minute iv SPX 1543, and Minute wave v currently underway. This wave labeling would suggest, barring an extension, we are currently in Minute v of Minor 5 of the Intermediate wave iii uptrend. On friday, in fact, the uptrend hit our original OEW 1552 pivot target. Although we expected this target to be reached in February.
Currently the weekly RSI is about as overbought as it gets for strong waves during this bull market: 89% SPX, and 91% DOW. The daily RSI is quite overbought at 80+%, and well below the peak of the uptrend at 90+%. Plus the MACD is displaying a negative divergence at these new highs. The hourly RSI also has a negative divergence. All in all it would appear this uptrend is drawing near to a conclusion. When it does top, we will expect about a 4% one month correction to follow for Intermediate wave iv. Medium term support is at the 1523 and 1499 pivots, with resistance at the 1552 and 1576 pivots.
SHORT TERM
Short term support is at the same 1523 and 1499 pivots, with resistance at the 1552 and 1576 pivots. Short term momentum ended the week with a negative divergence. The short term OEW charts remain positive with the reversal level now at SPX 1533.
While it is sometimes difficult to pinpoint an exact uptrend high. Especially after a somewhat tricky four month advance. We often use the OEW pivot ranges as a guideline, fibonacci, and the short term OEW charts. As of friday’s close the SPX sits just under the 1552 pivot, which has a range of SPX 1545-1559. Should this pivot get cleared, above 1560, then the market should enter the 1576 pivot range (1569-1583). It is unlikely this market will clear that pivot during this uptrend.
A larger fibonacci relationship was noted earlier with Int. wave iii equal to Int. wave i. On a lesser scale, during this uptrend: Minor wave 3 was 1.618 Minor 1, and Minor 5 is currently 0.50 Minor 3. So there is currently a cluster of price events. The short term OEW charts currently suggest a decline under SPX 1533 signals Intermediate wave iv is probably underway. This level rises during uptrends, and only declines during larger pullbacks. We update it everyday. So there you have it. Barring an extension event, this uptrend appears to be nearing its conclusion.
FOREIGN MARKETS
The Asian markets were mostly higher gaining 2.3%. China, HongKong, S. Korea remain downtrends, with India and Singapore also in downtrends but improving.
The European markets were mostly higher gaining 2.5%. Greece and Italy remain in downtrends.
The Commodity equity group were all higher gaining 1.5%. Brazil and Russia remain in downtrends.
The DJ World index is uptrending and gained 1.8%.
COMMODITIES
Bonds quickly reversed the recent uptrend and confirmed another downtrend, losing 1.4% on the week.
Crude continues to downtrend, but gained 0.9% on the week.
Gold continues to downtrend and ended the week flat.
The USD continues to uptrend gaining 0.6% on the week.
NEXT WEEK
Tuesday kicks off the economic week with the Budget deficit. Wednesday: Retail sales, Export/Import prices and Business inventories. Thursday: weekly Jobless claims and the PPI. Friday: Industrial production, the CPI, the NY FED, Consumer sentiment and it’s Options expiration. As for the FED. There is nothing scheduled ahead of the two day March 19th to 20th FOMC meeting. Best to your week!
CHARTS: http://stockcharts.com/...
http://caldaroew.spaces.live.com
After about 40 years of investing in the markets one learns that the markets are constantly changing, not only in price, but in what drives the markets. In the 1960s, the Nifty Fifty were the leaders of the stock market. In the 1970s, stock selection using Technical Analysis was important, as the market stayed with a trading range for the entire decade. In the 1980s, the market finally broke out of it doldrums, as the DOW broke through 1100 in 1982, and launched the greatest bull market on record.
Sharing is an important aspect of a life. Over 100 people have joined our group, from all walks of life, covering twenty three countries across the globe. It's been the most fun I have ever had in the market. Sharing uncommon knowledge, with investors. In hope of aiding them in finding their financial independence.
Copyright © 2013 Tony Caldaro - All Rights Reserved Disclaimer: The above is a matter of opinion provided for general information purposes only and is not intended as investment advice. Information and analysis above are derived from sources and utilising methods believed to be reliable, but we cannot accept responsibility for any losses you may incur as a result of this analysis. Individuals should consult with their personal financial advisors.
Tony Caldaro Archive |
© 2005-2022 http://www.MarketOracle.co.uk - The Market Oracle is a FREE Daily Financial Markets Analysis & Forecasting online publication.