


Stock Market's Flat, Having Entered Period of Confluence
Stock-Markets / Stock Markets 2013 Mar 09, 2013 - 05:27 PM GMTBy: Tony_Pallotta

 For the week ending March 8, 2013, the SPX was up 2.2%, the Russell small caps were up 3.0% and the COMP was up 2.4%.
All indices which had triggered short last week, were stopped out on Tuesday after stops were violated. The model has now entered a period of confluence with no trend yet determined. On an intermediate term basis, the trend remains up as the model triggered a long swing trade on Tuesday but this is viewed purely as a trade, not the start of a new trend. Only until support is tested and held would a long signal be triggered. Failure to hold support will then set up a test of short trigger levels.
The one noticeable change in equity this week was its failure to respond to the very strong risk on tailwinds provided by the JPY pairs and JPY futures during the latter part of the week. At this point it is just something to comment on, nothing more.
Another sign in the FX market was the continuation of the dollar strength which the model signaled long at 80.06. On all time frames, daily, weekly and monthly the DXY chart is very bullish. At the same time DXY is strong, JPY pairs and futures are likely finishing the final stage of an exhaustive trend. Should the pairs move lower while DXY moves higher this would signal a true risk off environment in the FX market.
Asset Class Correlations
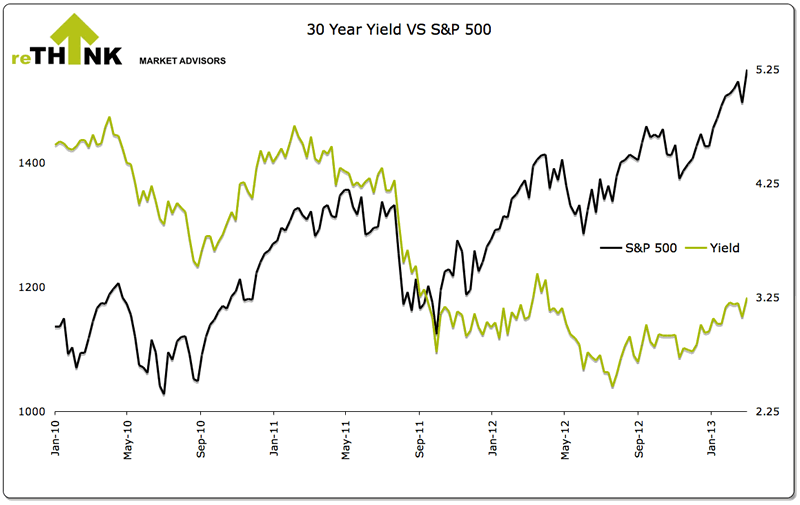
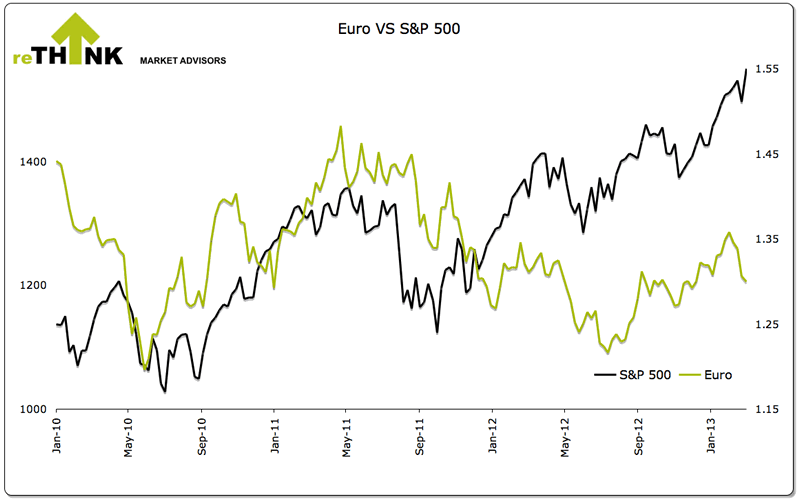
For the week ending March 8, 2013, the EUR was unchanged, 30 year yield was up 19bp and the Aussie Dollar was up 0.3%.
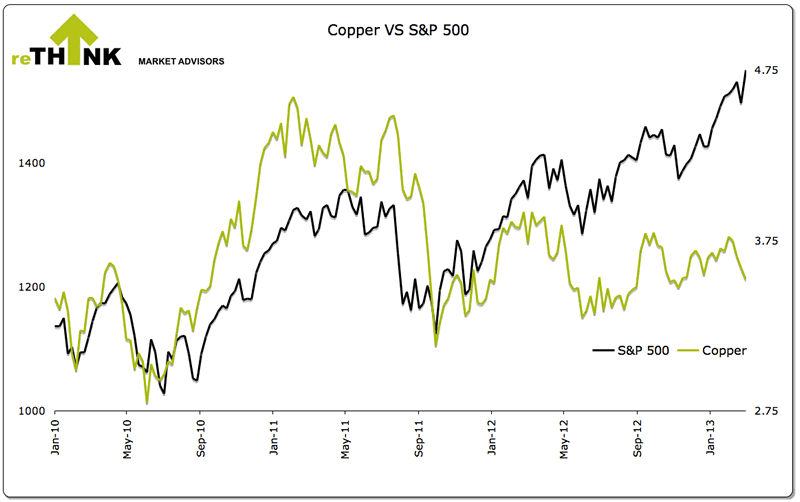
The commodity sector, after two weeks of heavy selling caught a minor bounce with DBC up 1.0%, oil up 0.9% though copper was unchanged. The model remains short oil and copper though downside momentum loss is noticeable.
The model remains short AUD/USD, long DXY and short EUR/USD. The current DXY profile is very bullish and a move to the mid 80's remains possible.
The multi-month divergence with equity and the EUR, AUD, copper and 30 year yield remains. As a result equity may show greater relative weakness as part of any future asset class convergence. Using any of these asset classes as a directional indicator may likely produce false signals. Our preference is to use JPY pairs.
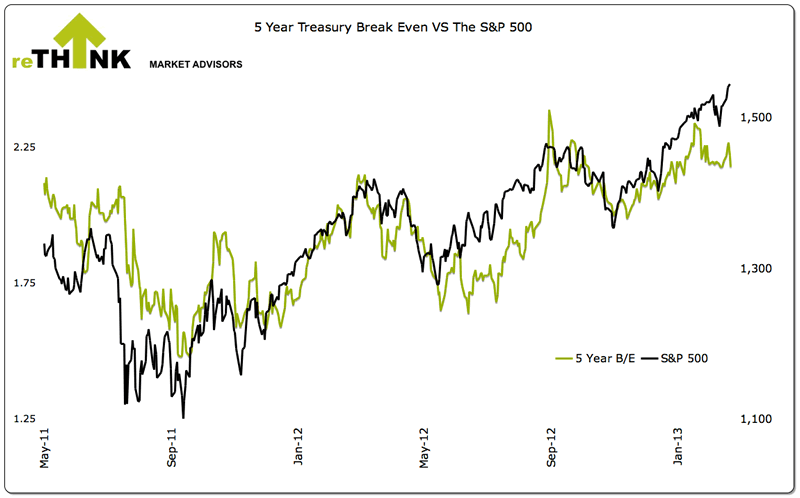
This week saw a continuation of the divergence with 5 year Treasury break evens which were down 2bp on the week.
Sentiment
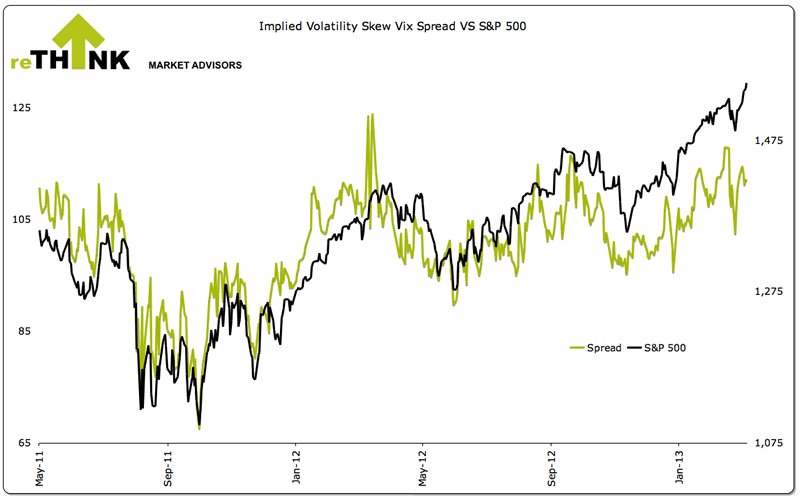
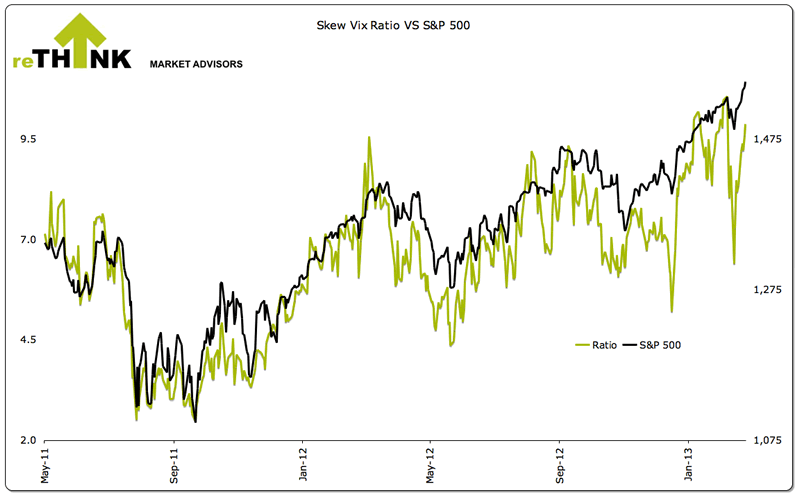
Volatility disappeared with the VIX down 18.1% on the week. This is now the second breakout in volatility only to fail to sustain the trend. The prior being the end of 2012. Implied volatility skew remains high, averaging 125.95 for the week and closing at 124.46, a fairly elevated level.
Skew is a measure of how implied volatility is distributed. The lower the reading the less skewed the curve, indicating a normalized distribution.
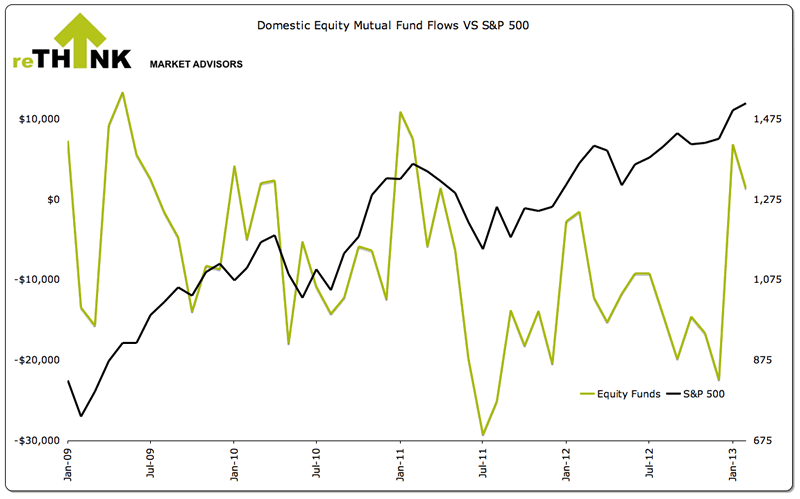
Funds Flow
For the period ending February 28, 2013, $1.1 billion flowed out of domestic equity funds while $5.0 billion flowed in to both municipal and taxable bonds. This ends the previous seven consecutive week of inflows to domestic equity funds.
For the month of February, domestic equity funds had a net inflow of $1.3 billion while bond funds had a net inflow of $20.7 billion. For 2012, domestic equity funds had a net outflow of $149.3 billion while bonds funds had a net inflow of $295.4 billion.
Bottom Line
All equity indices are now flat and have entered a period of confluence. Any directional trades are viewed purely as a trade and not a sustainable trend. Equity markets have become extremely volatile and additional upside cannot be ruled out. Therefore it is advised that stops be honored, regardless of one's qualitative view. It is also important to watch the JPY, both futures and pairs to gauge overall risk sentiment.
About The Big Picture: All technical levels and trends are based upon Rethink Market Advisor models, which are price and momentum based. They do not use trend lines nor other traditional momentum studies. To learn more about how the models work, please click here or visit http://rethink-markets.com/model-profile
© 2012 Copyright Tony Pallotta - Disclaimer: The above is a matter of opinion provided for general information purposes only and is not intended as investment advice. Information and analysis above are derived from sources and utilising methods believed to be reliable, but we cannot accept responsibility for any losses you may incur as a result of this analysis. Individuals should consult with their personal financial advisors.
Tony Pallotta Archive |
© 2005-2022 http://www.MarketOracle.co.uk - The Market Oracle is a FREE Daily Financial Markets Analysis & Forecasting online publication.