The Coming Ponzi U.S. Treasury Bond Market Crash
Interest-Rates / US Bonds Mar 09, 2013 - 01:17 PM GMTBy: Casey_Research
 It is my contention that the 70-year debt supercycle has come to an end.
To put the current financial situation in perspective, here's a long-term history of the debt-to-GDP ratio, which reached a record high at the beginning of the current crisis. It was a dramatic change in 2009, unlike anything since the aftermath of the Great Depression.
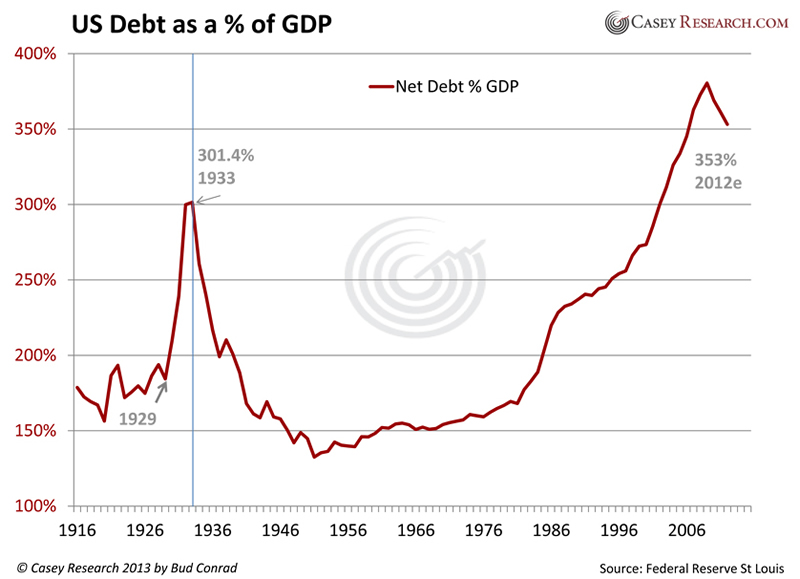
The highest the debt-to-GDP ratio had previously been for the United States was 301% at the bottom of the depression in 1933 when GDP collapsed and debt was high. The level became unsustainable in 2009, despite low interest rates. Weak borrowers were signing up to finance houses that they thought would increase in price forever. The point of the chart is that this downturn is different from all the recessions since World War II.
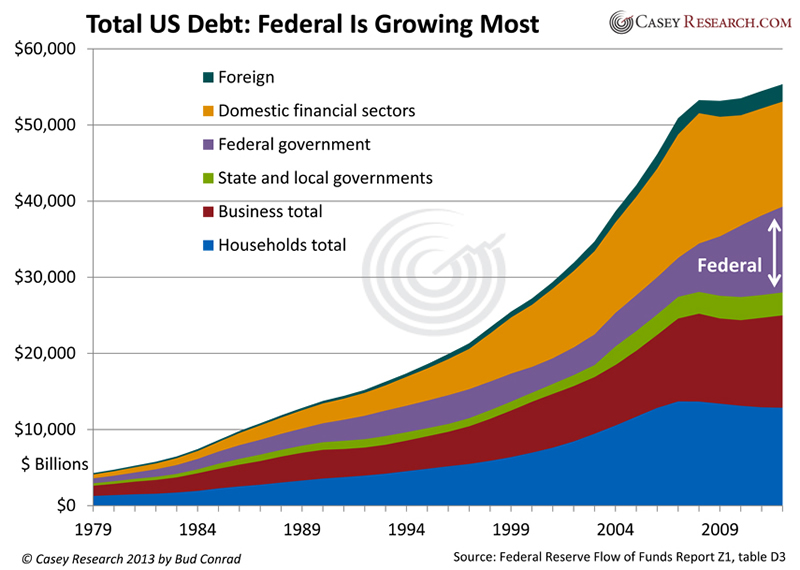
Total market debt includes debt of the federal government, state governments, households, business, financial institutions, and to foreigners. The components of the above total debt are shown below, so you can see which ones are stabilizing and which may be approaching unsustainable levels.
Looking forward, the most important problem is that the federal government has inserted itself into the economy with huge deficits to try to combat the slowing of the private sector. As you can see, private-sector borrowing has not increased, even as federal government deficits have ballooned to unprecedented levels. In essence, we are building our recovery on government debt.
The clear driver of this extreme expansion of government debt that I call a "Bond Bubble" is the Federal Reserve's flooding of markets with liquidity to drive rates to zero. The chart below shows a projection what will happen to the Fed's balance sheet as it continues to distort the rate to zero by extending its monthly purchases of $40 billion of mortgage-backed securities (MBS) and $45 billion of Treasuries out to 2016:
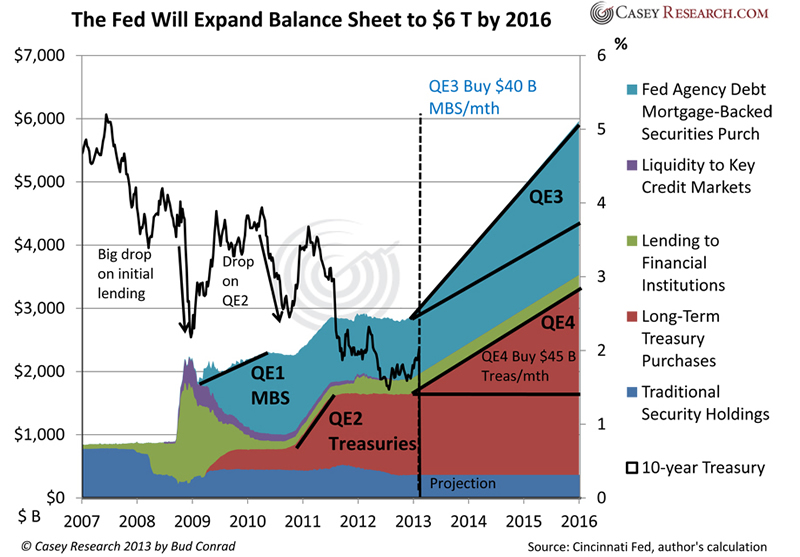
It is my contention that the actions of the Fed, which were started to counter the credit crisis of 2008 with four programs of quantitative easing, have brought us the incredibly low interest rates (aka, the Bond Bubble) we have today. By purchasing so many credit assets, the Fed is driving the price of bonds higher, and thus interest rates much lower, than they would otherwise be.
The black line in the chart above is the 10-year Treasury rate – you can see that it drops with each of the big balance sheet expansions. The resulting asset bubbles in stocks and housing are a direct result of the monetary creation by the Fed.
The growth in Fed purchases will likely continue so that the low rates of the Bond Bubble don't collapse. But the effects of the Fed's economic stimulus decline with each new injection of money.
There will come a time when the Fed announces a new program of balance sheet expansion by asset purchases that will cause the interest rate to rise because of fears of inflation from money creation, rather than fall as the Fed desires. At that point, we'll know the Fed's power to manipulate the economy has dissipated.
Just How Low Can Interest Rates Go?
The chart of 10-year Treasuries below shows that the current level of 2% is lower than it has ever been, except for a brief low of 1.5% last fall (blue line). It is the lowest in 240 years. This is happening in spite of government deficits expanding at a trillion dollars per year as far as the eye can see. We are at the bottom of a 32-year bull market in bonds (drop in rate).
To get a view of how extreme today's rate is, I added the red line, which is 100 divided by the interest rate. It shows a rise as rates fall and makes the bubble of low rates more obvious – which is currently higher than ever.
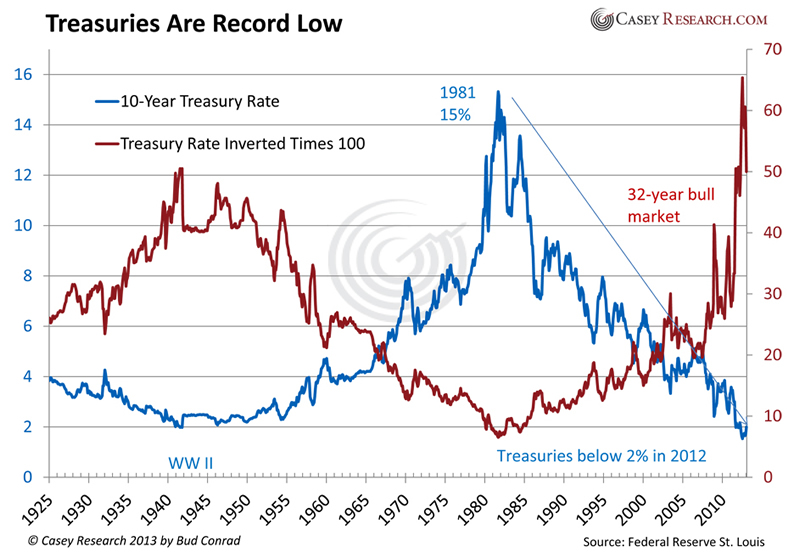
The point is that these extremely low rates are unprecedented, even when looking back to the last Great Depression. They could spring back a long way.
The low rates induced by the Fed are transmitted to many other market rates, as shown in the following charts. These charts need little comment, except that all of them confirm the simultaneous movement to many-decade lows.
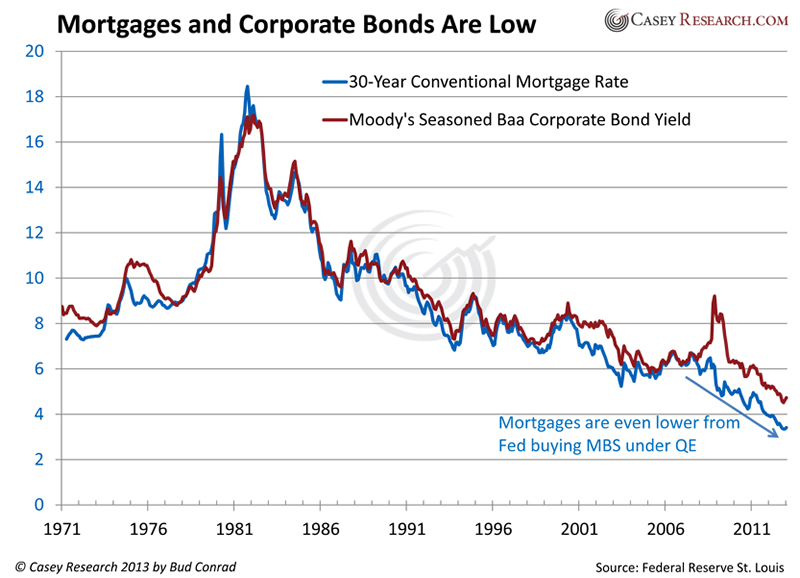
During the credit crisis, junk bonds were the worst performers as investors feared they would lose their money in default. Rates rose on BBB corporate debt as well. At the same time, government debt became the safe haven, and as people moved to the safe haven, they drove the price of Treasuries up and their interest rate down. The premium has gone out of the lower-rated markets, with rates even lower than before this crisis started. It's not that risk has disappeared: I think it is more likely that the flood of excess money is chasing any kind of return it can find, and that is driving rates to record-low levels.
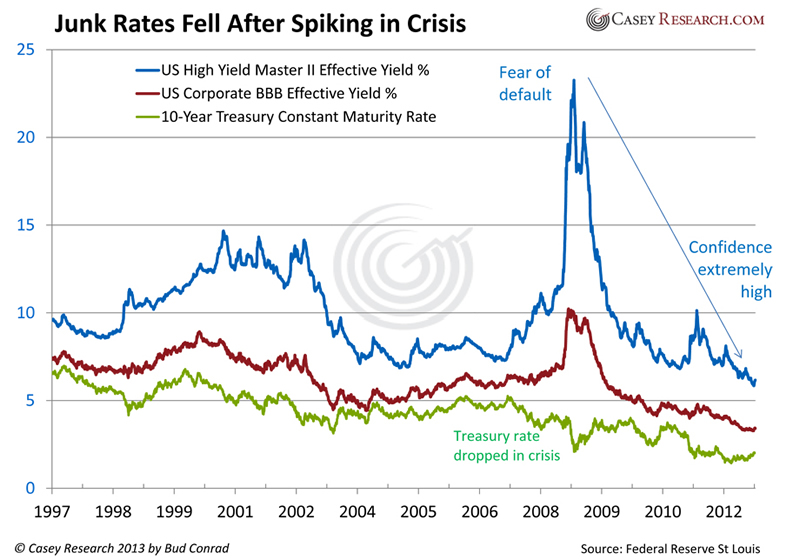
Inflation spiked dramatically in the 1973 and 1979 oil crises. More recently, official government numbers haven't shown wild inflation. Prices for energy, food and domestic services – like medical care and education – have had big jumps. But thanks to cheap foreign manufacturing, we are able to import goods at attractive prices, so overall inflation doesn't reflect the extreme money creation by the Fed. Wage growth is nonexistent, largely due to foreign competition and high unemployment from offshoring manufacturing.
The forces of inflation can easily overcome a weak economy to destroy a currency: this has happened in countries like Zimbabwe, Argentina or Yugoslavia. Once things get out of hand, it is hard to say whether it is the weak economy that causes the government spending and further deficit destruction of the currency, or the reverse. But that doesn't matter once people lose confidence in the government and its paper issuance.
The chart below shows government numbers for inflation that seem awfully low compared to what most people experience. The erratic behavior of commodities is likely to continue, so I think prices will continue to rise.
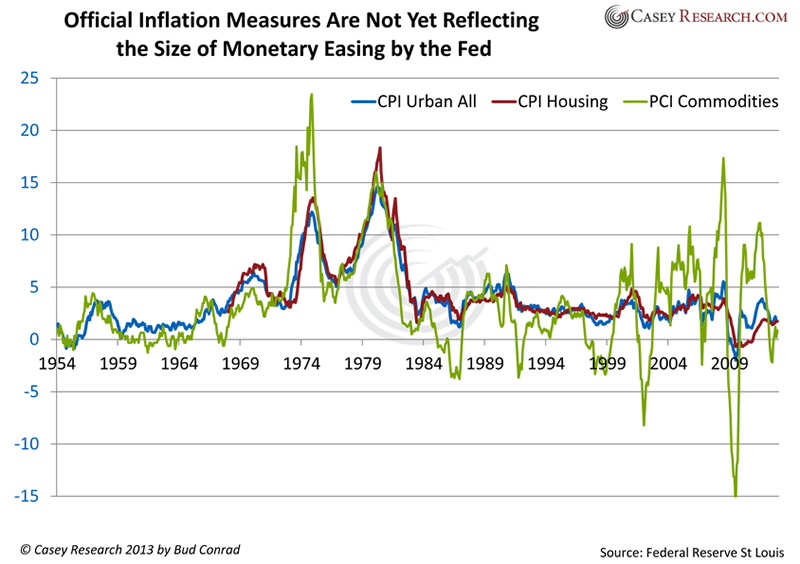
But even using these conservative government numbers, when we subtract the inflation from the interest rate to show the real return to an investor, we get negative numbers. This, too, is unsustainable.
A Look at Interest Rates Worldwide
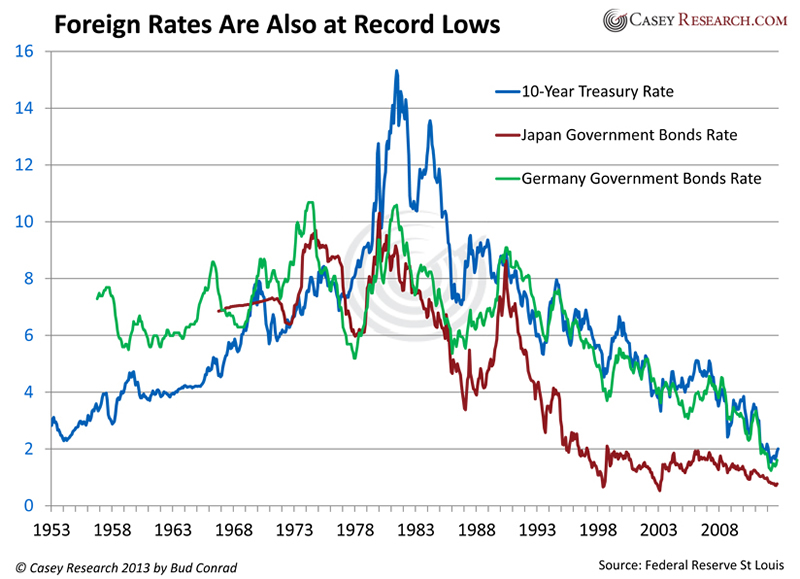
I've written extensively in previous articles about central bank expansion, but it's worth reminding ourselves that excessive money creation is not just a US phenomenon but a worldwide experiment. Once this feeds back on itself as ordinary people recognize the destruction of the fiat currency systems, we can expect inflation on a worldwide basis. The similar decline in interest rates in Germany and Japan is the result of their central bank interventions to support their economies by driving rates lower.
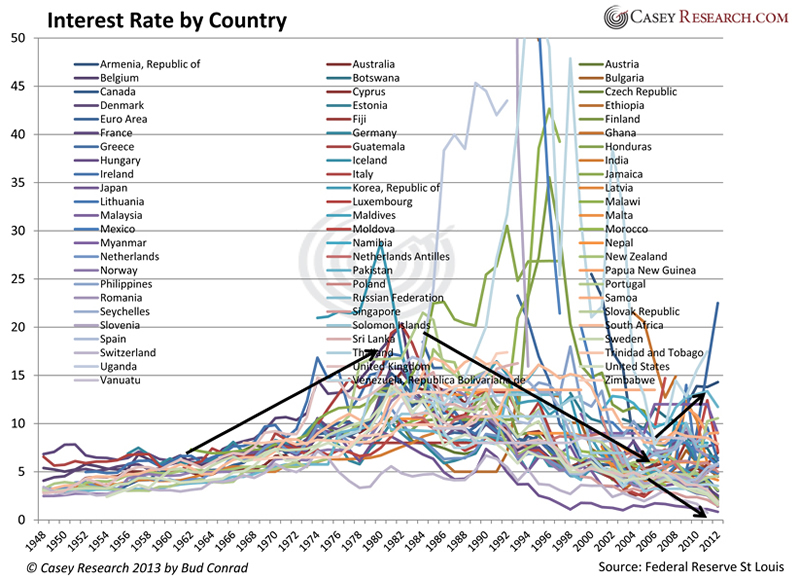
The chart below, which shows the interest rates of 187 countries, has some underlying patterns. At first blush it just looks like spaghetti, but if you step back, you can see that rates were rising into 1980. Then many fell until the recent crisis, after which new deviations appear. In Europe, rates went both ways: up for the PIIGS and down for the safe havens like Germany.
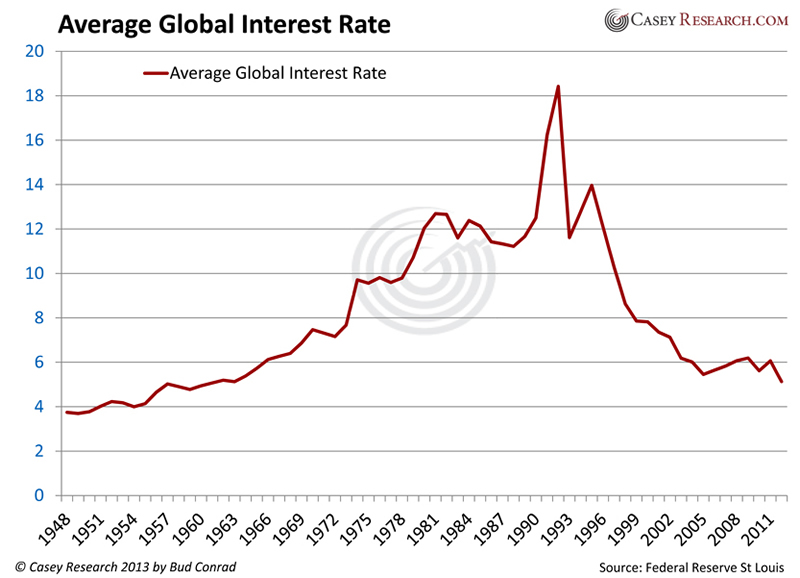
And here is a simplification of the above by just averaging the numbers to a single line in which you can see an imprecise confirmation that, despite wide variability, there is an underlying pattern in world markets.
The above six charts confirm that rates of all kinds are at 50-year record lows.
Debt and Interest Rates Suggest Higher Rates Are Possible
The chart below shows the comparison of Greece's growing debt (in blue) and the resulting rise in interest rate. You can see that as Greece's debt to GDP rose above 100%, the interest rate rose toward 20%. Lenders lost confidence in the ability of the Greek government to actually pay back its debt.
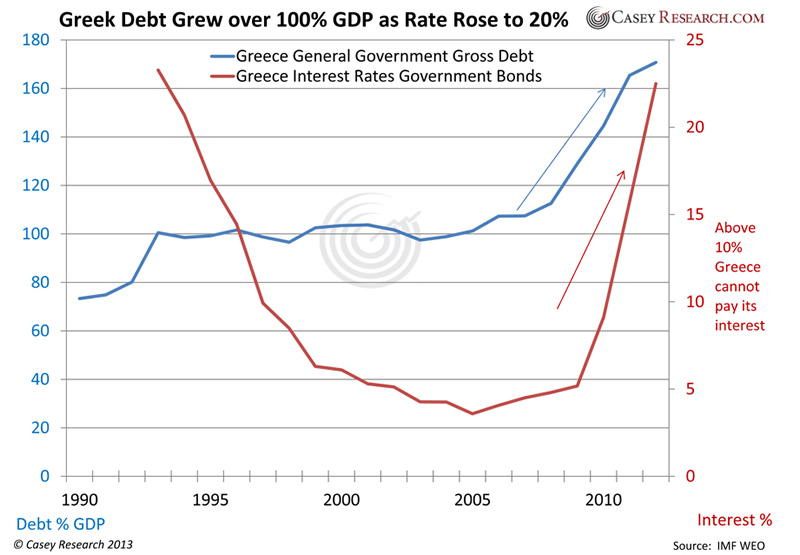
In contrast, the stronger countries have been able to accommodate their government debt increase and still maintain moderate interest rates. The United States is shown in the following chart. Central banks have aided the government in managing to keep rates low despite big deficits, by buying the debt. Balance sheets of the world's central banks are growing rapidly to support government deficits while forcing rates to low levels. It is a bubble.
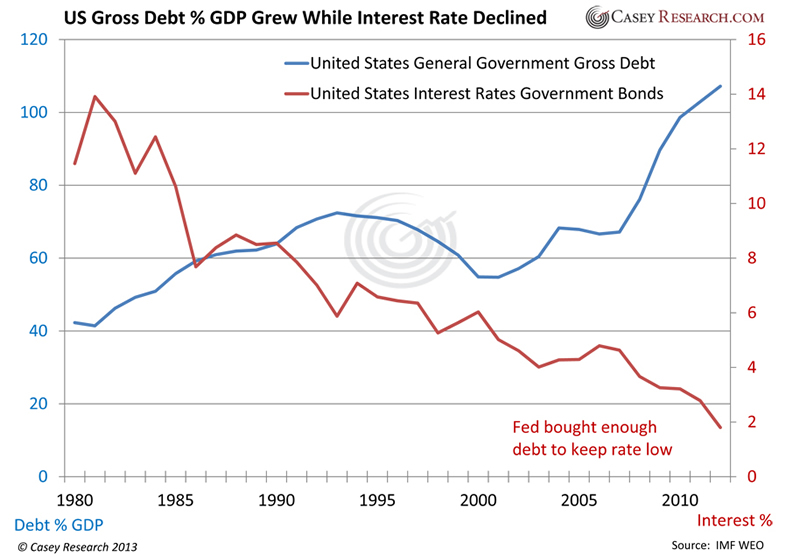
When you buy Treasury bonds, you are putting your fate in the hands of the government, expecting it to give back your purchasing power and a reasonable amount of interest to you, in return for the use of your money. Should you trust these authorities with your money? I believe we are headed for a serious loss of confidence in the value of the dollar, which will be accompanied by a burst of the Bond Bubble.
This Ponzi scheme is getting ready to explode.
Between now and that day of reckoning, you can rest assured the purchasing power of your money will continue to erode. This, of course, means that to make a profit, you have outpace inflation. One of the best approaches you can take is to follow the lead of contrarian investing legend Doug Casey and invest in emerging trends…
© 2013 Copyright Casey Research - All Rights Reserved
Disclaimer: The above is a matter of opinion provided for general information purposes only and is not intended as investment advice. Information and analysis above are derived from sources and utilising methods believed to be reliable, but we cannot accept responsibility for any losses you may incur as a result of this analysis. Individuals should consult with their personal financial advisors.
Casey Research Archive |
© 2005-2022 http://www.MarketOracle.co.uk - The Market Oracle is a FREE Daily Financial Markets Analysis & Forecasting online publication.


