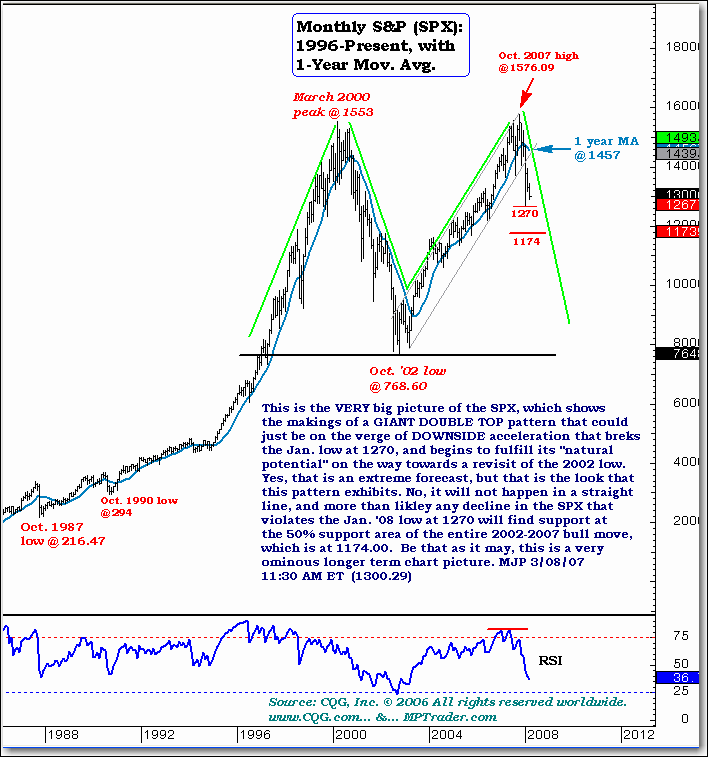
Ominous S&P 500 Stock Market Chart- Warning of Oct 2002 Target
Stock-Markets / Stocks Bear Market Mar 07, 2008 - 03:32 PM GMTBy: Mike_Paulenoff

 The very big picture of the S&P 500 chart -- (AMEX: SPY) for traders of the ETF -- shows the making of a giant double-top pattern that could be on the verge of downside acceleration that breaks the January low at 1270 and begins to fulfill its "natural potential" on the way towards a revisit of the 2002 low. Yes, that is an extreme forecast, but that is the look that this pattern exhibits. No, it will not happen in a straight line, and more than likely any decline in the SPX that violates the January 2008 low at 1270 will find support at the 50% support area of the entire 2002-2007 bull move, which is at 1174.00. Be that as it may, this is a very ominous longer-term chart picture.

Sign up for a free 15-day trial to Mike's ETF Trading Diary today.
By Mike Paulenoff
Mike Paulenoff is author of the MPTrader.com (www.mptrader.com) , a real-time diary of Mike Paulenoff's trading ideas and technical chart analysis of Exchange Traded Funds (ETFs) that track equity indices, metals, energy commodities, currencies, Treasuries, and other markets. It is for traders with a 3-30 day time horizon, who use the service for guidance on both specific trades as well as general market direction
© 2002-2008 MPTrader.com, an AdviceTrade publication. All rights reserved. Any publication, distribution, retransmission or reproduction of information or data contained on this Web site without written consent from MPTrader is prohibited. See our disclaimer.
Mike Paulenoff Archive |
© 2005-2022 http://www.MarketOracle.co.uk - The Market Oracle is a FREE Daily Financial Markets Analysis & Forecasting online publication.


