Striking Similarity to the 2000 Stock Market Top
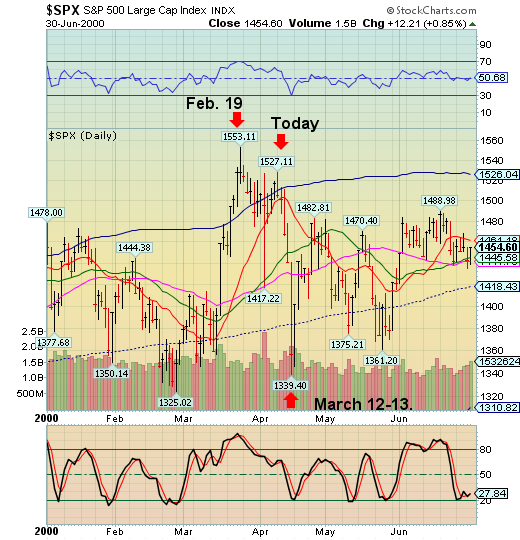
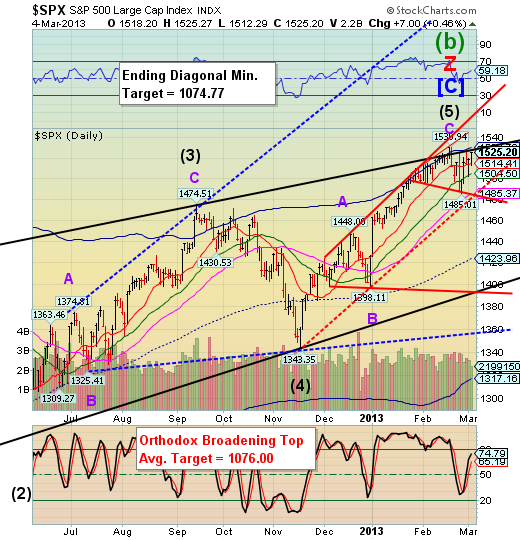
Stock-Markets / Stock Markets 2013 Mar 05, 2013 - 10:49 AM GMT I thought I would share what my Cycle Clock is revealing. Essentially it is telling me that the fractal in the SPX is very similar to that of the SPX/NDX in early 2000. While there are many differences, I am referring to the striking similarities in the highs and lows of these two separate fractals.
The high on February 19 matches up precisely with the high on March 24, 2000 in the SPX. Likewise, today’s high also matches up with the April 10 high, just before the 4-day decline into the April 17 low.

The current fractal appears to be going down into March 12, which makes the decline 6 days instead of 5. I have to point out that fractals are self-similar, not identical, so we may see some deviations from the original model.
Today is a double pivot day, which implies that either we have already seen the high today or may see a reversal early tomorrow.
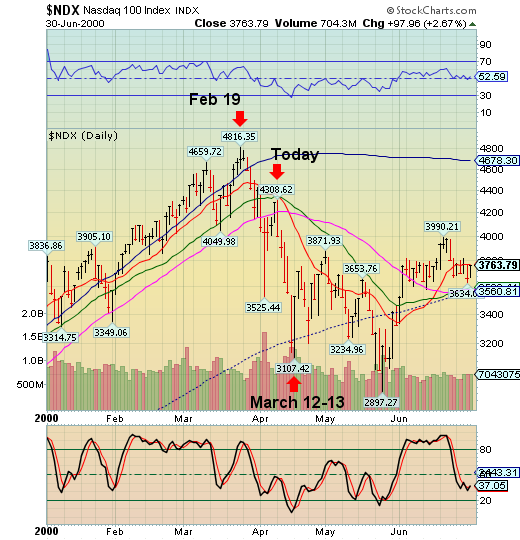
Here’s the NDX fractal. The high that I marked “today” actually occurred one market day earlier than the SPX, but I think the dimensions of this fractal with a 35% decline are closer to today’s setup than the mere 14% decline shown in the SPX. In fact, the NDX rallied 520 days prior to this “crash.” That is also a similar number of days from the October 4, 2011 low to February 19, 2013 high (503 days).

There are several differences today, as well. The NDX made its Final high this time on September 21, 2012, so is not a part of this study of current fractals. What I am saying is that fractals, which are self-similar, may have a tendency to repeat, but not in ways that one may expect. And they may recur in different indices, but in the same or similar time frame.
The big differences between 2000 and today may have to do with today’s Broadening Tops, which are crash fractals and the fact that we have been on the receiving end of QE for 4 years now, whereas the Fed under Alan Greenspan had just pumped fresh money into the market in 1999 to forestall a potential crash of the Y2K bug as the computers turned over from 1999 to 2000.

I think that the differences between then and now are greater than the similarities. But the fascinating thing is the repetition of this fractal in time is what alerted me to its probable outcome.
Regards,
Tony
Our Investment Advisor Registration is on the Web
We are in the process of updating our website at www.thepracticalinvestor.com to have more information on our services. Log on and click on Advisor Registration to get more details.
If you are a client or wish to become one, please make an appointment to discuss our investment strategies by calling Connie or Tony at (517) 699-1554, ext 10 or 11. Or e-mail us at tpi@thepracticalinvestor.com .
Anthony M. Cherniawski, President and CIO http://www.thepracticalinvestor.com
As a State Registered Investment Advisor, The Practical Investor (TPI) manages private client investment portfolios using a proprietary investment strategy created by Chief Investment Officer Tony Cherniawski. Throughout 2000-01, when many investors felt the pain of double digit market losses, TPI successfully navigated the choppy investment waters, creating a profit for our private investment clients. With a focus on preserving assets and capitalizing on opportunities, TPI clients benefited greatly from the TPI strategies, allowing them to stay on track with their life goals
Disclaimer: The content in this article is written for educational and informational purposes only. There is no offer or recommendation to buy or sell any security and no information contained here should be interpreted or construed as investment advice. Do you own due diligence as the information in this article is the opinion of Anthony M. Cherniawski and subject to change without notice.
Anthony M. Cherniawski Archive |
© 2005-2022 http://www.MarketOracle.co.uk - The Market Oracle is a FREE Daily Financial Markets Analysis & Forecasting online publication.


