Warning: Stock Market Likely to Crash From Here, 50% Drop!
Stock-Markets / Financial Crash Feb 28, 2013 - 05:37 PM GMTBy: Dr_Martenson
 I don't relish the job of constantly pointing out the risks to the equity markets. But since few on Wall Street seem willing (or able) to do this, I'm "making the call" for a market correction, as enough variables have aligned to indicate a high likelihood of stocks heading downwards from here.
I've only given one other such warning about equities before, and that was in March of 2008, when I warned of the possibility of a 40% to 60% decline in stock prices by Fall. I am making a similar call today, with the understanding that I am usually a bit early to the game with my views.
Before I get into the details, the broad outline is that I see a case where speculative fevers, propelled by the Fed's $85 billion thin-air money printing program, have more or less run their course, with the Dow and S&P indexes stalled near their all-time highs. That is, $85 billion a month is what it takes to merely keep the Dow near 14,000 and the S&P 500 near 1,500.
On a fundamental basis, I see numerous signs of consumer weakness, political in-fighting and paralysis in DC, high insider selling, and the return of the retail investor (a.k.a. "greater fool") to the stock market.
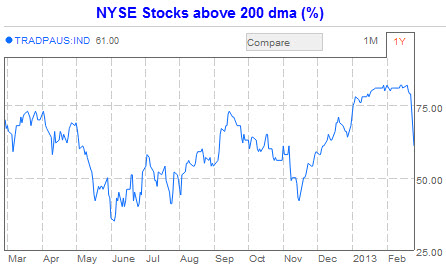
On a technical basis, there are numerous tell-tale signs of a market top, including too much bullish sentiment, waning momentum on multiple timeframes, and too many NYSE stocks being above their 200-day moving average (at least until recently; that's begun to correct).
(Source)
Triple Top?
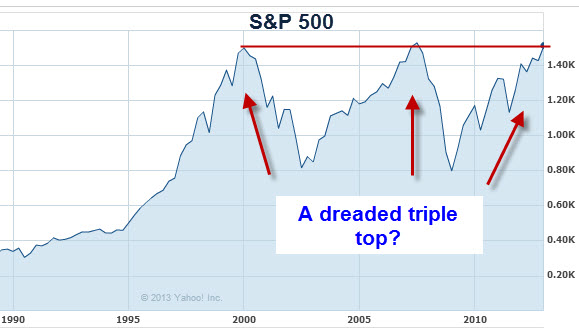
The S&P 500 and Dow Jones are both once again near all-time highs…for the third time. The old saying third time’s a charm can work both ways when it comes to the stock market. Sometimes an index will bust through to new highs, and other times it will fail spectacularly crashing to new lows.
We should all be watching the behavior of the major indexes here, because the possibility of a major triple-top failure is quite high, for reasons outlined below.
If the S&P 500 fails at the triple top and breaks down, from a charting perspective the next thing for it to do is revisit the bottom and then make up its mind as to what it wants to do next. The implication here is that a major failure of the S&P 500 will open the possibility of it revisiting the 600-800 level, or some 45% to 60% lower from the 1,500 level where it currently churns.
It will take some time to get to that level, typically 3-6 months, unless there’s some sort of financial accident to hasten things along, in which case it could all be over in a month or two.
Assuming a failure at the triple top, we’ll just have to watch and see what the market wishes to do once it plumbs the bottom once again. For now, the daily and weekly charts of the S&P 500 show waning momentum, and the weekly chart remains in overbought territory (green lines and circles):
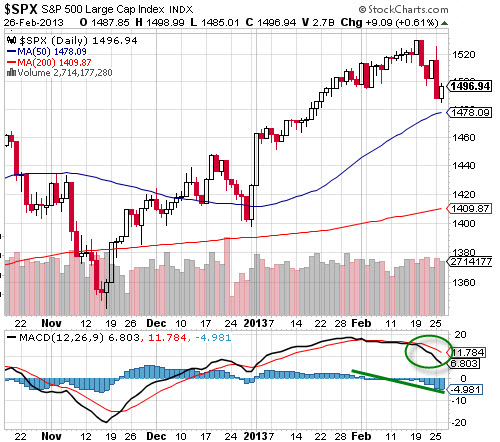
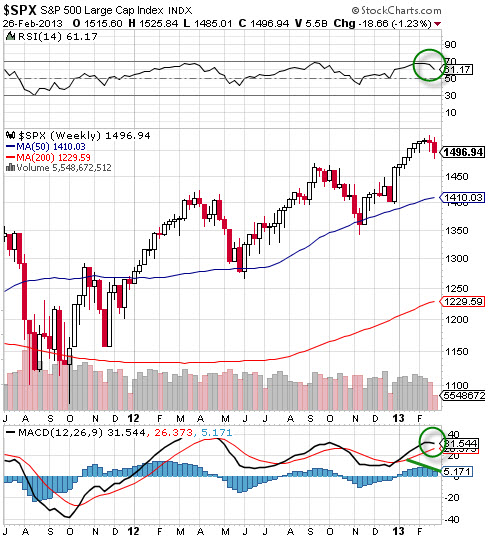
These overbought and slumping momentum indicators are headwinds to the Fed’s efforts to keep the stock market elevated.
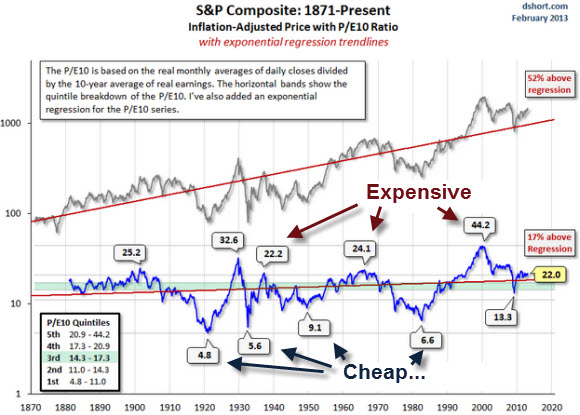
From a historical standpoint, stocks are cheap when they sport a collective p/e in the high single digits. Currently they are anything but cheap on that basis.
(Source)
With a current p/e of 22, the S&P 500 is on the expensive – rather than cheap – side of things, and is roughly 35% above its long-term average and more than 100% above what we could legitimately call 'cheap.'
The summary here is that if stocks do indeed retreat from here, a triple-top failure will deliver quite a punishing blow to the current efforts to repair the public’s trust in the stock market as a place to send their hard-earned savings to grow. It would be quite difficult to engineer a run at a fourth top, given the importance of retail participation in providing fuel for the rise of stocks – especially given that the boomers are retiring at the rate of 10,000 per day and drawing upon their investments instead of adding to them.
The younger generation(s) have been the main victims of the high unemployment and general wage stagnation that have been the hallmarks of the Great Recession. It is not likely that they will be able to save and invest at a rate equal to the boomer's withdrawals, creating one more equity headwind for the Fed to overcome.
Sell in May and Go Away
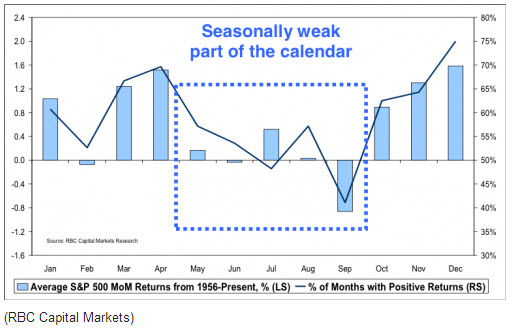
Of course, another old adage that applies to the stock market is sell in May and go away, which has proven to be a remarkably effective strategy over the years. The average return between May and September is -0.5%, while it is over 12% for the rest of the year.
(Source)
Why this yearly vacillation of returns occurs is open to speculation, but a betting person would have to think long and hard about buying stocks here – with May approaching and the Dow and S&P at all-time highs – rather than staying on the sidelines and then buying back in September or October if one was so inclined.
However, given the macro forces at play at this time, this May-to-September period could easily offer much more dramatic losses than 0.5%. I am personally thinking as much as two full orders of magnitude greater, as -50% is right in the middle of my target window for losses.
As always, the best time to begin repositioning one’s portfolio is before any big moves get underway, so I personally would not wait until May to make adjustments, assuming one was of a mind to do so.
Whether or not you forego selling stocks, lighten up your positions, or take on some form of portfolio protection in the form of puts or inverse ETFs, these seem like good things to do before April is over.
Danger Ahead
Technically stocks are overbought. Fundamentally, the picture is even worse: they are facing a litany of economic drags (including weakening GDP growth, higher taxes, the impact of Obamacare, sequester cuts, high gasoline prices, chronic unemployment, etc.) and robust insider selling. We explore these fundamental risks and their likely impact in great depth in Part II.
For all of these reasons, equity markets face a very high chance of falling over 40% between now and fall of 2013. (Yes, I'm aware of how extreme a price prediction this is.)
While there’s always a chance that the Fed can keep things magically elevated – and they’ve done a very good job so far – it is my view that they cannot do this for much longer without a serious correction to justify an even larger program of overt and covert intervention.
In Part II: How the Market Failure Will Happen, I detail how the pattern I expect to see will play out – and why I expect the fall in equity prices to happen within the May-September window. This downdraft will be characterized by lots of volatility, formed by market routs and Fed-inspired rescues, alternating until some form of bottom is reached. Along the way there will likely be a flight for "safety" into the dollar and Treasury paper, but only during the first stage of the next crisis.
Once a bottom is reached – again, this might be anywhere from 40% to 60% lower than the current ~1500 level on the S&P 500 – the process will begin to be dominated by rising government borrowing, which will cause interest rates to begin to rise.
When that happens, expect capital to flee the paper market for hard assets. In particular, that's when the upwards price revolution in the gold and silver markets will kick into high gear.
Click here to read Part II of this report (free executive summary; enrollment required for full access).
By Dr Martenson
© 2013 Copyright Dr Martenson - All Rights Reserved
Disclaimer: The above is a matter of opinion provided for general information purposes only and is not intended as investment advice. Information and analysis above are derived from sources and utilising methods believed to be reliable, but we cannot accept responsibility for any losses you may incur as a result of this analysis. Individuals should consult with their personal financial advisors.
© 2005-2022 http://www.MarketOracle.co.uk - The Market Oracle is a FREE Daily Financial Markets Analysis & Forecasting online publication.


