Don’t Be Fooled by Multi-Year Stock Market Highs
Stock-Markets / Stock Markets 2013 Feb 27, 2013 - 04:23 PM GMT George Leong writes: The equities market continues to hover near its multi-year highs. There are still many Wall Street analysts who suggest that the bulls are in full control and will drive stocks higher.
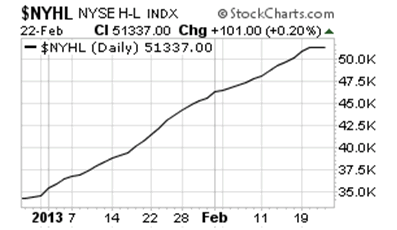
Investor sentiment had been extremely bullish in each session since the start of the year, but a neutral rating was reported on February 21–22, as shown in the chart below.

Chart courtesy of www.StockCharts.com
We are still seeing optimism on Wall Street from the bulls, with some market watchers calling for the Dow to crack 15,000, and move upward toward 20,000. Even the small-cap Russell 2000, which recently traded at a record high, is up nearly 10% this year. Based on an annualized rate, the Russell 2000 would advance over 60% this year, considering what has happened so far. I actually think some of the euphoria in the equities market is overblown.
While Wall Street and the media may still feel the equities market will continue to move higher, I believe there’s some real risk in the equities market that you should be aware of.
While I’m not calling for a stock market correction, I do see red flags out there that suggest some selling pressure may be on the horizon for the equities market.
Take a look at the Dow. The blue-chip index has failed on two occasions to hold above 14,000, so there appears to be some topping action, based on my technical analysis. The reality is that selling in blue chips would be a red flag in the equities market.
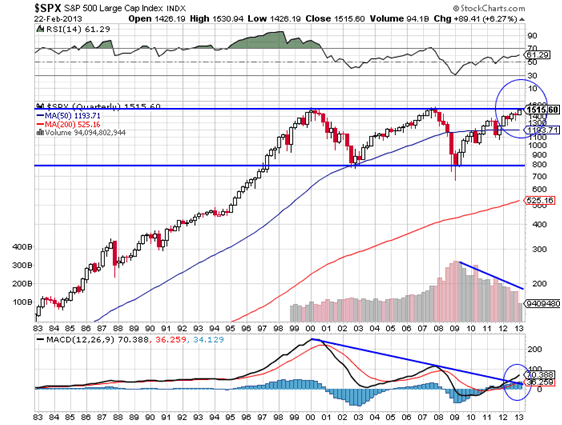
In the broader market, while the S&P 500 initially held at 1,500, the index did see an intraday breach below 1,500 on February 21. My concern is that the potential topping at 1,500, which I have discussed before in these pages, occurred in 2000 and 2007, so we may be looking at a third multi-year top at this time, based on my technical analysis.

Chart courtesy of www.StockCharts.com
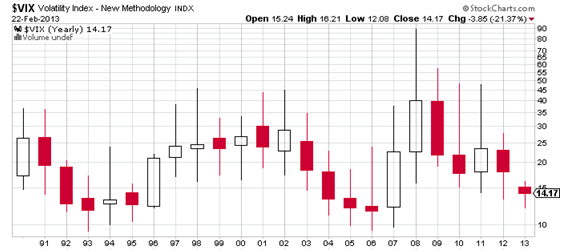
Just take a look at the Chicago Board Options Exchange (CBOE) Volatility Index (VIX), which is also widely known as the “fear factor” and is based on the S&P 500. The VIX reading surged above 15 last Friday, which is well below some of the high readings since 1990, as shown on the chart below. The lower VIX reading means the market is relaxed and unconcerned with the current climate; but you need to remain alert, as investor mistakes occur when you are too confident.

Chart courtesy of www.StockCharts.com
Indications on the charts and in the market suggest there may be a near-term top surfacing in the equities market, so you will need to be really aware of this. Just the rapid rise in stocks this year should give you a sense of concern, as gains are clearly not sustainable.
At this juncture, I advise adopting a wait-and-see approach toward the equities market.
As a precaution to a possible stock market correction, you should make sure you are hedged via the use of index put options on key stock indices, such as the S&P 500, the NASDAQ, and the Dow, amongst others.
If the equities market sinks, you can also pick up some gold investments as a hedge and a safe haven for your capital.
By George Leong, BA, B. Comm.
www.investmentcontrarians.com
Investment Contrarians is our daily financial e-letter dedicated to helping investors make money by going against the “herd mentality.”
George Leong, B. Comm. is a Senior Editor at Lombardi Financial, and has been involved in analyzing the stock markets for two decades where he employs both fundamental and technical analysis. His overall market timing and trading knowledge is extensive in the areas of small-cap research and option trading. George is the editor of several of Lombardi’s popular financial newsletters, including The China Letter, Special Situations, and Obscene Profits, among others. He has written technical and fundamental columns for numerous stock market news web sites, and he is the author of Quick Wealth Options Strategy and Mastering 7 Proven Options Strategies. Prior to starting with Lombardi Financial, George was employed as a financial analyst with Globe Information Services. See George Leong Article Archives
Copyright © 2013 Investment Contrarians- All Rights Reserved Disclaimer: The above is a matter of opinion provided for general information purposes only and is not intended as investment advice. Information and analysis above are derived from sources and utilising methods believed to be reliable, but we cannot accept responsibility for any losses you may incur as a result of this analysis. Individuals should consult with their personal financial advisors.
Investment Contrarians Archive |
© 2005-2022 http://www.MarketOracle.co.uk - The Market Oracle is a FREE Daily Financial Markets Analysis & Forecasting online publication.


