U.S. Housing Bubble - Why It's Always the Best Time to Buy Houses
Housing-Market / US Housing Feb 26, 2013 - 03:03 PM GMTBy: James_Quinn
 “The continuing shortages of housing inventory are driving the price gains. There is no evidence of bubbles popping.” – David Lereah, NAR mouthpiece/economist – August 2005
"The steady improvement in home sales will support price appreciation despite all the wild projections by academics, Wall Street analysts, and others in the media." – David Lereah, NAR mouthpiece/economist – January 10, 2007
"Buyer traffic is continuing to pick up, while seller traffic is holding steady. In fact, buyer traffic is 40 percent above a year ago, so there is plenty of demand but insufficient inventory to improve sales more strongly. We've transitioned into a seller's market in much of the country. We expect a seasonal rise of inventory this spring, but it may be insufficient to avoid more frequent incidences of multiple bidding and faster-than-normal price growth.” – Lawrence Yun – NAR mouthpiece/economist – February 21, 2013
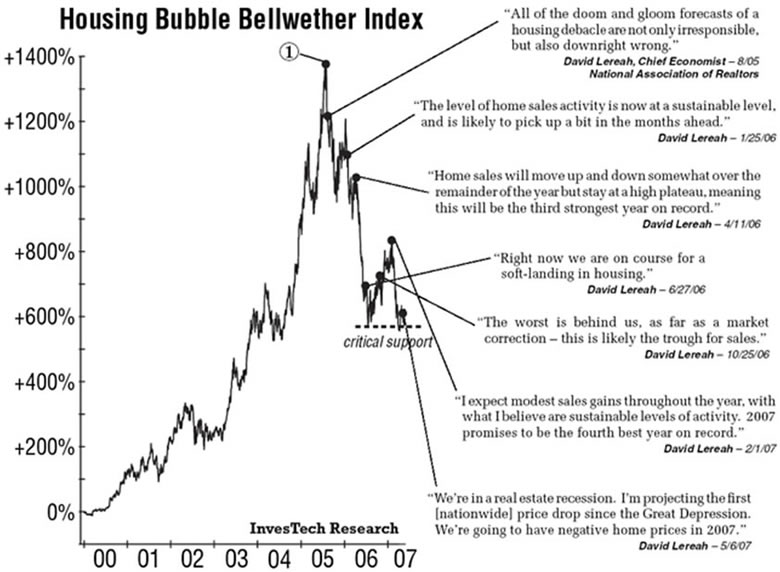
I really need to stop being so pessimistic. I’m getting richer by the day. My home value is rising at a rate of 1% per month according to the National Association of Realtors. At that rate, my house will be worth $1 million in less than 10 years. My underwater condo (figuratively – not literally) in Wildwood will resurface and make me rich beyond my wildest dreams. Larry Yun, the brilliant economic genius employed by the upstanding and truth telling NAR, reported that median home prices soared by 12.3% in January (down 3.7% from December) over the prior year and there is virtually no inventory left to sell – with a mere 1.75 million homes in inventory – the lowest level since 1999. The median sales price of $173,600 is up “dramatically” from last year’s $154,500 level. I’m sure the NAR meant to mention that home prices are still down 25% from the 2005 high of $230,000. Every mainstream media newspaper, magazine, and news channel is telling me the “strong” housing recovery is propelling the economy and creating millions of new jobs. Keynesian economists, Wall Street bankers, government apparatchiks and housing trade organizations are all in agreement that the wealth effect from rising home prices will be the jumpstart our economy needs to get back to the glory days of 2005. Who am I to argue with such honorable men with degrees from Ivy League schools and a track record of unquestioned accuracy as we can see in the chart below?
Mr. Lereah added to his sterling reputation with his insightful prescient book Why the Real Estate Boom Will Not Bust—And How You Can Profit from It, which was published in February 2006. I understand Ben Bernanke has a signed copy on his nightstand. According to David, he voluntarily decided to leave the NAR in mid-2007 as home prices began their 40% plunge over the next four years. He then admitted in an interview with Money Magazine in 2009 that he was nothing but a shill for the real estate industry, no different than a whore doing tricks for $20. Except he was whoring himself for millions of dollars and contributing to the biggest financial fraud in world history:
“I was pressured by executives to issue optimistic forecasts — then was left to shoulder the blame when things went sour. I was there for seven years doing everything they wanted me to. I worked for an association promoting housing, and it was my job to represent their interests. If you look at my actual forecasts, the numbers were right in line with most forecasts. The difference was that I put a positive spin on it. It was easy to do during boom times, harder when times weren’t good. I never thought the whole national real estate market would burst.”
After Mr. Lereah slithered away from his post he was replaced by the next snake – Lawrence Yun. He proceeded to put the best face possible on the greatest housing collapse in recorded history, assuring the public it was the best time to buy during the entire slide. Five million foreclosures later he’s still telling us it’s the best time to buy. Why shouldn’t we believe the National Association of Realtors and the mainstream media that report their propaganda as indisputable fact? These noble realtooors only have the best interests of their clients at heart. Remember when they warned people about the dangers of liar loans, negative amortization loans, appraisal fraud, nefarious mortgage brokers, criminal bankers, corrupt ratings agencies and the fact that home prices had reached a high two standard deviations above the normal trend? Oh yeah. They didn’t make a peep. They disputed and ridiculed Robert Shiller and anyone else who dared question the healthy “strong” housing market storyline. In late 2011 this superb, above board, truth telling organization admitted what many financial analysts and “crazy” bloggers had been pointing out for years. They were lying about home sales. Their data was false. Between 2007 and 2011, the NAR reported 2.95 million more home sales than had actually occurred. This was not a rounding error. This was not a flaw in their methodology, as they claimed. It was an outright fraudulent attempt to convince the public that the housing market was not in free fall. These guys make the BLS look accurate and above board.
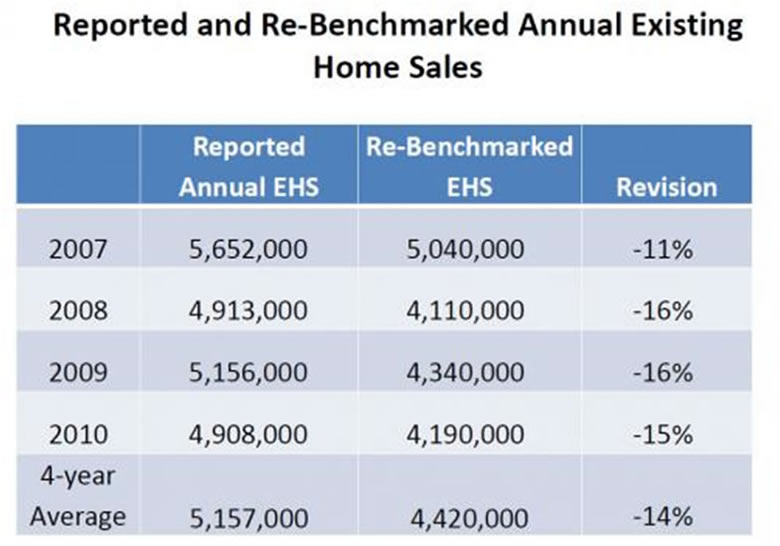
We are now expected to believe their monthly reports as if they are gospel. The mainstream media continues to report their drivel about the lowest inventory level in 14 years without the slightest hint of skepticism.
The Incredible Shrinking Inventory
We are told by good old Larry Yun that there are only 1.74 million homes left for sale in this country and at current sales rates we’ll run out of inventory in 4.2 months. Oh the horror. You better buy now, before it’s too late. We must be running out of houses. Someone call Bob Toll. We need more houses built ASAP, before this becomes a crisis. But there seems to be problem with this storyline. Existing home sales are falling. Even using the NAR seasonally manipulated numbers, sales in January were lower than in November. In a country with 133 million housing units, there were 291,000 existing home sales in January. If there is an inventory shortage, why have new home sales fallen every month since May of 2012? There were a total of 10,000 completed new homes sold in December in the entire country. Housing starts plunged by 8.5% in January. Does this happen when you have a strong housing market? Do you believe the NAR inventory figure of 1.74 million homes for sale? The last time the months of supply was this low was early 2005 – during the good old days.
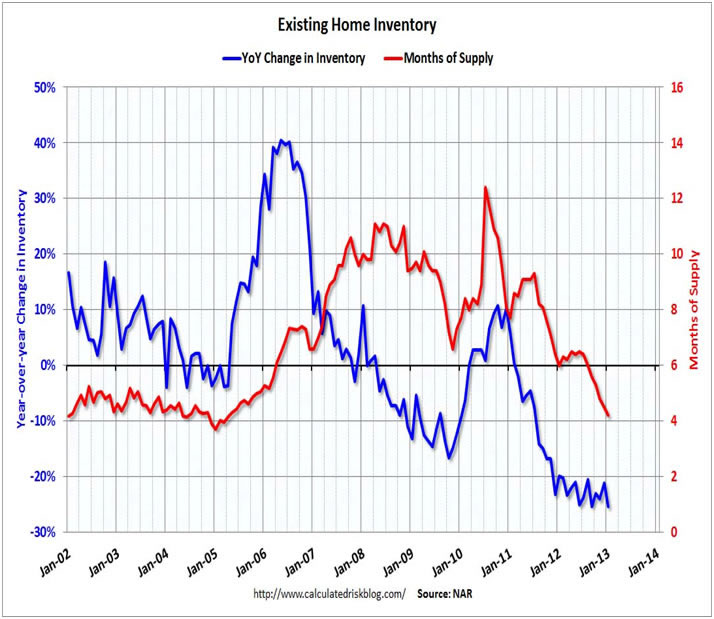
Let’s examine a few facts to determine the true nature of this shocking inventory shortage. According to the U.S. Census Bureau:
- There are 133 million housing units in the United States
- There were 115 million occupied housing units in the country, with 75 million owner occupied and 40 million renter occupied.
- For the math challenged this means that 13.5%, or 18 million housing units, are vacant.
- Only 4.3 million are considered summer homes, and 3.9 million are available for rent. That leaves 9.8 million homes completely vacant.
- The Census Bureau specifically identifies 1.6 million of these vacant housing units as up for sale.
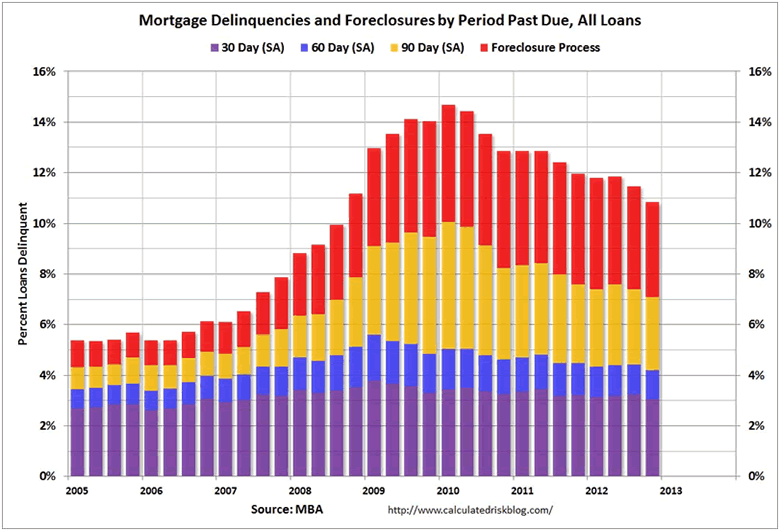
So, with 9.8 million vacant housing units in the country and 1.6 million of these identified as for sale, the NAR and media mouthpieces have the balls to report only 1.74 million homes for sale in the entire U.S. This doesn’t even take into account the massive shadow inventory stuck in the foreclosure pipeline. Of the 75 million owner-occupied housing units in the country, 50 million have a mortgage. Of these houses, a full 10.9% are either delinquent or in the foreclosure process. This totals 5.4 million households, with 1.9 million of these households already in the foreclosure process. The number of distressed households is still double the long-term average, even with historically low mortgage rates, multiple government mortgage relief programs (HARP), and Fannie, Freddie and the FHA guaranteeing 90% of all mortgages. Do you think the NAR is including any of these 5.4 million distressed houses in their inventory numbers?
Then we have the little matter of a few home occupiers still underwater on their mortgages. After this fabulous two year housing recovery touted by shills and shysters, only 27.5% of ALL mortgage holders are underwater on their mortgage. This means 13.8 million households are in a negative equity position. Those with 5% or less equity are effectively underwater since closing costs usually exceed 6% of the house’s value. That adds another 2.2 million households to the negative equity bucket. Do you think any of these 16 million households would be selling if they could?
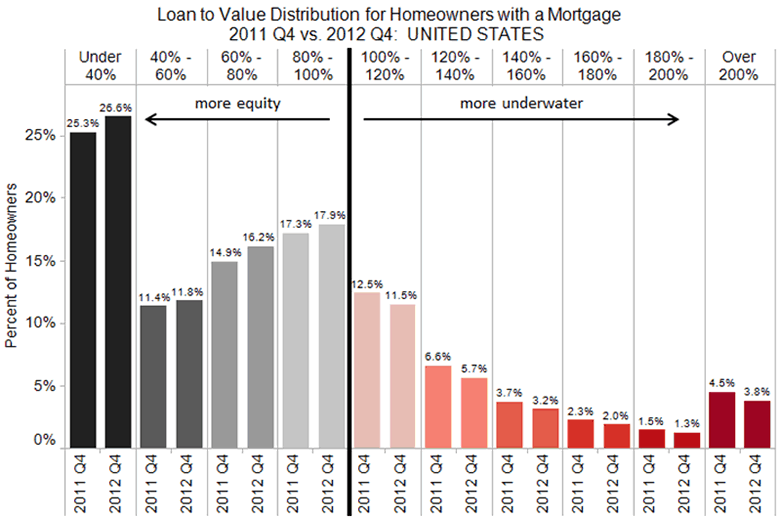
The negative equity position of millions of homeowners gets at the gist of the effort to re-inflate the housing bubble. By artificially pumping up home prices, the Wall Street titans and their co-conspirators at the Federal Reserve and Treasury Department are attempting to repair insolvent Wall Street bank balance sheets, lure unsuspecting dupes back into the housing market, reignite the economy through the old stand-by wealth effect, and of course enrich themselves and their crony capitalist friends. The artificial suppression of home inventory has been working wonders, as 2 million homeowners were freed from negative equity in 2012. If they can only lure enough suckers back into the pool, all will be well. Phoenix must have an inordinate number of chumps with home prices rising by 22.5% in 2012 as investors and flippers poured into the market with cheap debt and big dreams. Of course everything is relative, as prices are still down 44% from the peak and 40% of mortgages remain underwater. I strongly urge everyone without a functioning brain to pour their life savings into the Phoenix housing market. Larry Yun says it’s a can’t miss path to riches.
Despite the propaganda, hyperbole, and cheerleading from the corporate media, the fact remains that national homeowner’s equity is barely above its all-time low of 38%, down from 62% in 2000 and 70% in 1980. The NAR shills, Federal Reserve drug pushers, Wall Street shysters, and pliant media lured the middle class into the false belief that housing was an asset class that could make you rich. Homes became the major portion of middle class net worth. As prices were driven higher from 2000 through 2006, the middle class took the bait hook line and sinker and borrowed billions against their ever increasing faux housing wealth. This set up the impending collapse of middle class net worth, created by the 1%ers on Wall Street, in Washington DC, and in corporate executive suites across the land. The median American household lost 47% of its wealth between 2007 and 2010. Average household wealth, which is skewed dramatically by the richest Americans, declined by only 18%. Real estate only accounts for 30% of the net worth of the rich. For the middle 60%, housing has risen from 62% to 67% of total wealth since 1983. Middle class families’ saw their cash cushion fall from 21% in 1983 to 8% before the crash. They were convinced that living on Wall Street peddled debt was the path to prosperity. After the crash, the middle class has been left with no cash, underwater mortgages, declining real wages, less jobs, and a mountain of credit card debt. Delusions have been crushed. But an on-line degree from the University of Phoenix funded by a Federal student loan of $20,000 will surely revive the fortunes of the average unemployed middle class worker.
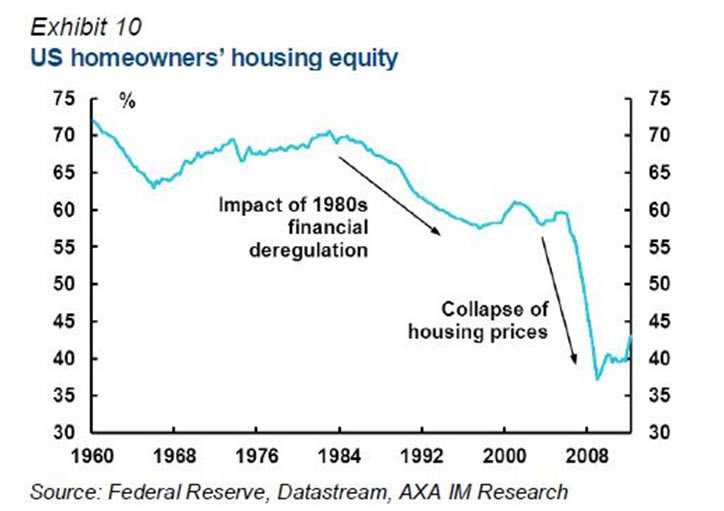
Despite the destruction of middle class hopes, dreams, and net worth, the ruling plutocracy has decided the best way to revive their fortunes is to lure the ignorant masses into more student loan debt, auto debt and mortgage debt.
Don’t Look Behind the Curtain
“The real hopeless victims of mental illness are to be found among those who appear to be most normal. Many of them are normal because they are so well adjusted to our mode of existence, because their human voice has been silenced so early in their lives that they do not even struggle or suffer or develop symptoms as the neurotic does. They are normal not in what may be called the absolute sense of the word; they are normal only in relation to a profoundly abnormal society. Their perfect adjustment to that abnormal society is a measure of their mental sickness. These millions of abnormally normal people, living without fuss in a society to which, if they were fully human beings, they ought not to be adjusted.” – Aldous Huxley – Brave New World Revisited
What is normal in a profoundly abnormal, manipulated, propaganda driven society? The NAR and Federal government issue their public relations announcements every month and attempt to spin straw into gold. The media then fulfill their assigned role by touting the results as unequivocal proof of an economic recovery. This is all designed to revive the animal spirits of the clueless public. Statistics in the hands of those who have no regard for the truth can be manipulated to portray any storyline that serves their corrupt purposes. When I see a story about the housing market referencing a percentage increase as proof of a recovery I know it’s time to check the charts. You see, even a fractional increase from an all-time low will generate an impressive percentage increase. So let’s go to the charts in search of this blossoming housing recovery.
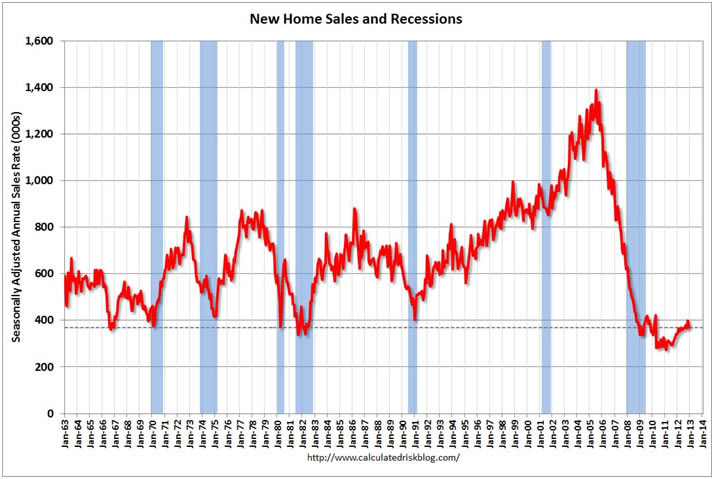
The media, NAHB, and certain bloggers look at this chart and declare that new home sales are up 20% from 2011 levels. Sounds awesome. I look at this chart and note that 2011 was the lowest number of new home sales in U.S. history. I look at this chart and note that new home sales are 75% below the peak in 2005. I look at this chart and note that new home sales are lower today than at the bottom of every recession over the last fifty years. I look at this chart and note that new home sales are lower today than they were in 1963, when the population of the United States was a mere 189 million, 40% less than today’s population. Do you see any signs of a strong housing recovery in this chart?
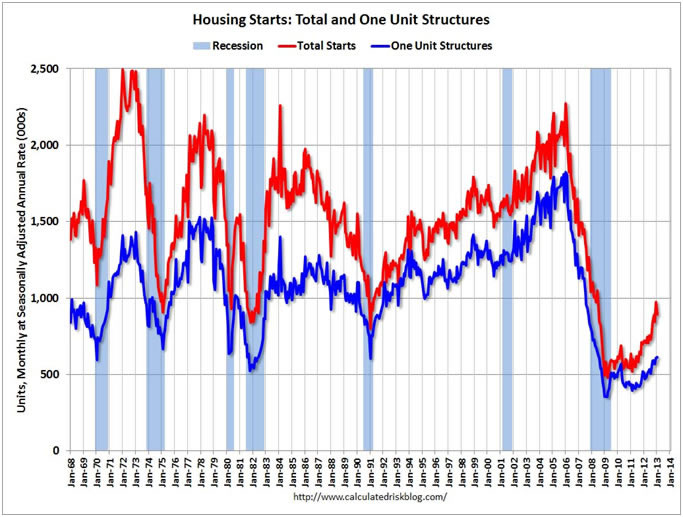
The housing cheerleaders look at the chart below and crow about a 75% increase in housing starts. I look at this chart and note that housing starts in 2009 were the lowest in recorded U.S. history. I look at this chart and note that total housing starts are down 60% and single family starts are down 70% from 2006 highs. I look at this chart and note the “surge” in housing starts is completely being driven by apartment construction, because the student loan indebted youth can’t afford to buy houses. I look at this chart and note that housing starts are 40% below 1968 levels. Do you see any signs of a strong housing recovery in this chart?
Those trying to lure the gullible non-thinking masses into paying inflated prices for the “few” houses available for sale declare that existing home sales are up 50% in the last two years. Of course, the 3.3 million low in 2010 was the lowest level in decades. Existing home sales are still 30% below the 2005 high of 7.2 million and the abnormal structure of these home sales is dramatically different than the normal sales of yesteryear.
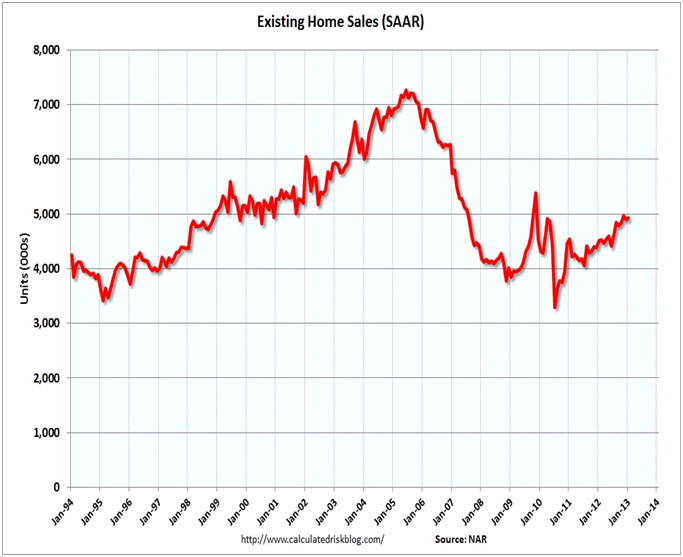
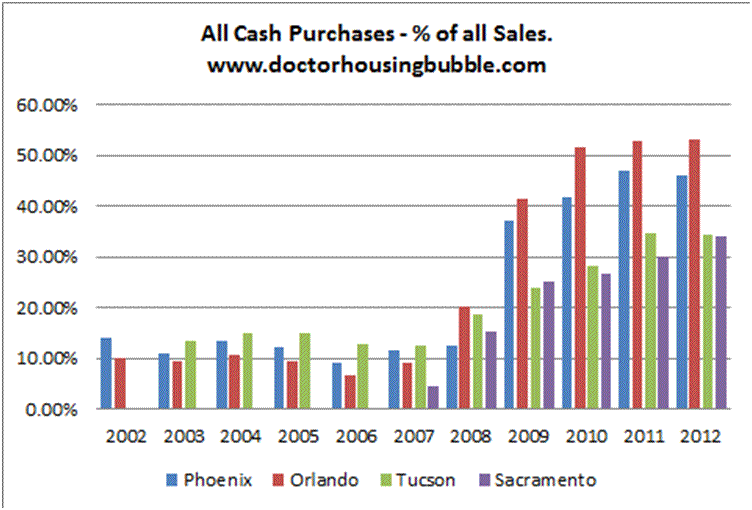
The wizards behind the curtain don’t want you to understand how the 50% increase in existing home sales has been achieved. They just want you to be convinced that a return to normalcy has happened and it’s the best time to buy. The NAR wizards and the media wizards don’t publicize the composition of these skyrocketing sales. At the end of the NAR “buy a home before it’s too late” monthly press release you find out that distressed homes (foreclosed & short sales) now make up 23% of all home sales and have accounted for well over 30% of all home sales since 2010. Another 28% of home sales are all-cash sales to investors looking to turn them into rental units or flip them for a quick buck. Lastly, 30% of homes are being bought by first time home buyer pansies who have been lured into the market by 3.5% down payment loans through the FHA, with the future losses born by middle class taxpayers who had no say in the matter. Prior to the housing crash, normal buyers who just wanted a place to live, accounted for 90% of all home purchases. Today they make up less than 30% of home buyers. Does this chart portray a normal market or a profoundly abnormal market? Does it portray a healthy housing recovery based upon sound economic fundamentals?
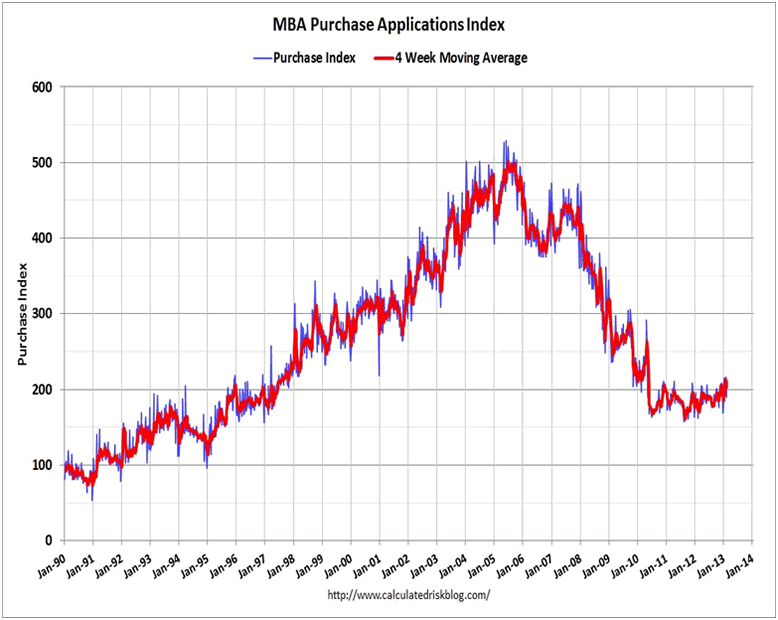
The answer is NO. The contrived elevation of home sales and home prices has been engineered by the very same culprits who crashed our financial system in the first place. This has been planned, coordinated and implemented by a conspiracy of the ruling oligarchy – the Federal Reserve, Wall Street, U.S. Treasury, NAR, and the corporate media conglomerates. Ben’s job was to screw senior citizens and drive interest rates low enough that everyone in the country could refinance, attract investors & flippers into the market, and propel home prices higher. Wall Street has been the linchpin to the whole sordid plan. They were tasked with drastically limiting the foreclosure pipeline, therefore creating a fake shortage of inventory. Next, JP Morgan, Blackrock, Citi, Bank of America, and dozens of other private equity firms have partnered with Fannie Mae and Freddie Mac, using free money provided by Ben Bernanke, to create investment funds to buy up millions of distressed properties and convert them into rental properties, further reducing the inventory of homes for sale and driving prices higher. Only the connected crony capitalists on Wall Street are getting a piece of this action. The Wall Street big hanging dicks have screwed the American middle class coming and going. The NAR and media are tasked with what they do best – spew propaganda, misinform, lie, cheerlead and attempt to create a buying frenzy among the willfully ignorant masses. The chart below reveals the truth about the strong sustainable housing recovery. It doesn’t exist. Mortgage applications by real people who want to live in a home are no higher than they were in 2010 when home sales were 33% lower than today. Mortgage applications are lower than they were in 1997 when 4 million existing homes were sold versus the 5 million pace today. The housing recovery is just another Wall Street scam designed to bilk the American middle class of what remains of their net worth.
The multi-faceted plan to keep this teetering edifice from collapsing is being executed according to the mandates of the financial class:
- Distribute hundreds of billions in student loans to artificially suppress the unemployment rate, while the BLS adjusts millions more out of the labor force - CHECK
- Have Ally Financial (80% owned by Obama) and Wall Street banks dole out subprime auto loans to millions and offer 7 year financing at 0%, while GM (Government Motors) channel stuffs its dealers, to create the appearance of an auto recovery – CHECK
- Drive mortgage rates down, restrict home supply through foreclosure market manipulation, shift the risk of losses to the taxpayer, and allow Wall Street to control the housing market – CHECK
- Have the corporate mainstream media continuously spout optimistic, positive puff pieces designed to convince an ignorant, apathetic public that the economy is improving, jobs are being created, and housing has recovered – CHECK
Free money, government subsidies, no regulation, Wall Street hubris, get rich quick schemes, media propaganda, and an ignorant public – what could possibly go wrong?
Here is what could and will go wrong. Everyone in the country that could refinance to a mortgage rate of 4% or lower has done so. Contrary to Bernanke’s rhetoric that “QE to Infinity” would lower mortgage rates, they have just risen to a six month high as the 10 Year Treasury rose 60 basis points from its 2012 low. If mortgage rates just rose to a modest 5% the housing market would come to a grinding halt as no one would trade a 3.5% mortgage for a 5% mortgage. As I’ve detailed earlier, there are 3.9 vacant housing units available for rent. Almost half of the new housing units under construction are apartments. The Wall Street shysters are converting millions of foreclosed homes into rental units. This avalanche of rental properties will depress rents and destroy the modeled ROI calculations of the brilliant Wall Street Ivy league MBAs. These lemmings will all attempt to exit their “investments” at the same time. The FHA is already broke. The mounting losses from their 3.5% down payment to future deadbeats program will force them to curtail this taxpayer financed debacle. There will be few first time home buyers, as young people saddled with a trillion dollars of student loan debt are incapable of buying a home.
These are the facts. But why trust facts when you can believe Baghdad Ben and the NAR? It’s always the best time to buy.
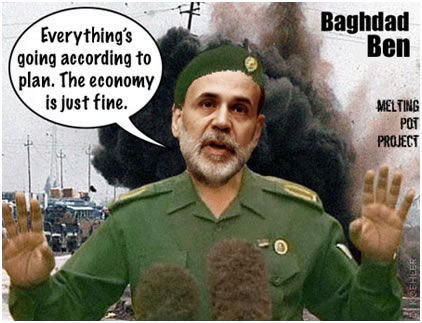
"All that said, given the fundamental factors in place that should support the demand for housing, we believe the effect of the troubles in the subprime sector on the broader housing market will likely be limited, and we do not expect significant spillovers from the subprime market to the rest of the economy or to the financial system. The vast majority of mortgages, including even subprime mortgages, continue to perform well. Past gains in house prices have left most homeowners with significant amounts of home equity, and growth in jobs and incomes should help keep the financial obligations of most households manageable." – Ben Bernanke – May 17, 2007
Join me at www.TheBurningPlatform.com to discuss truth and the future of our country.
By James Quinn
James Quinn is a senior director of strategic planning for a major university. James has held financial positions with a retailer, homebuilder and university in his 22-year career. Those positions included treasurer, controller, and head of strategic planning. He is married with three boys and is writing these articles because he cares about their future. He earned a BS in accounting from Drexel University and an MBA from Villanova University. He is a certified public accountant and a certified cash manager.
These articles reflect the personal views of James Quinn. They do not necessarily represent the views of his employer, and are not sponsored or endorsed by his employer.
© 2013 Copyright James Quinn - All Rights Reserved
Disclaimer: The above is a matter of opinion provided for general information purposes only and is not intended as investment advice. Information and analysis above are derived from sources and utilising methods believed to be reliable, but we cannot accept responsibility for any losses you may incur as a result of this analysis. Individuals should consult with their personal financial advisors.
James Quinn Archive |
© 2005-2022 http://www.MarketOracle.co.uk - The Market Oracle is a FREE Daily Financial Markets Analysis & Forecasting online publication.


