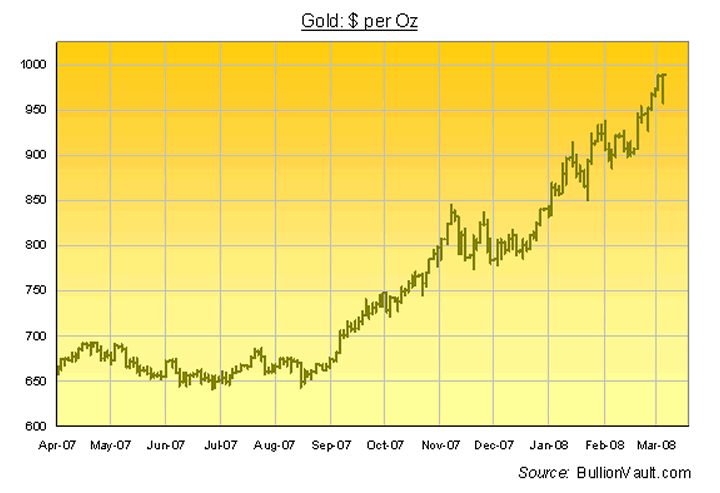
Gold: Two All-Time Records with $30 Between
Commodities / Gold & Silver Mar 05, 2008 - 02:54 PM GMTBy: Adrian_Ash
"...Miss your chance to buy gold at a $30 discount last night...?"
WELL THAT CAME and went pretty quick!
Gold Prices dumped almost $30 per ounce late Tuesday, only to pick them right back up again by Wednesday's close in London , before racing above $990 per ounce as New York wound down the day by itself.
What in the hell is going on here? We're not given to making forecasts or proffering investment advice here at BullionVault . We're busy enough as it is simply watching the Gold Market and trying to make sense of it all, as well as offering private investors who share our current unease a safe, simple and cost-efficient route into direct gold ownership.
Beyond that, to our mind, how you make or lose money in today's financial markets is entirely your own concern – and it's a serious concern, too. The lack of investor scrutiny at Enron, Refco and Northern Rock prove that.
But three observations on the current state of the Gold Market stand out today. Not least with the Federal Reserve on track to lop another 75 basis points off the returns paid to Dollar holders when it meets on March 18th.

Whether you currently own gold or not, just consider:
#1. How Gold Got Here
The uptrend in world Gold Prices starting in July 1999 clearly entered a new phase last August. This distinct new stage coincided to the very day with Ben Bernanke's first cut to US interest rates in response to the global banking crisis – the 0.5% cut to the discount rate announced on Aug. 17th.
#2. The Need for a Thick Pencil
Any technical analyst armed with a high-low-close chart of gold (as above) would point out the clear "trading channel" that's developed since Nov. 2007, about half-way through the Fed-inspired move. Use a thick enough pencil – the stock-in-trade of decent chartists, of course – and this week's sharp drop began right on the upper trendline at the latest all-time high of $989.55 per ounce
#3. Volatility's Rising
Both in terms of Dollar-value and percentage swings, the price of Gold has become horribly volatile since the start of this year. Indeed, since the start of last month it's averaged a near 2.1% move across every two sessions.
You can see the gap widening violently between the highs and lows marked on our chart. Prior to last month, the average two-day swing of the previous 12 months was nearer just 1.6%.
So new gold buyers today, whether leveraged or not, are set for truly stomach-churning volatility at today's current nose-bleed prices. Anyone making the jump now – and defying the siren voices of many professional pundits – may not make any money for sure.
But having the front to buy now, nearly 50% higher inside six months, is a feat requiring almost as big a pig-head as Buying Gold at the all-time bottom of eight years ago.
Your certain reward? Sudden, sharp moves that come and go almost as fast as this week's $30 drop between two new all-time records.
By Adrian Ash
BullionVault.com
Gold price chart, no delay | Free Report: 5 Myths of the Gold Market
City correspondent for The Daily Reckoning in London and a regular contributor to MoneyWeek magazine, Adrian Ash is the editor of Gold News and head of research at www.BullionVault.com , giving you direct access to investment gold, vaulted in Zurich , on $3 spreads and 0.8% dealing fees.
(c) BullionVault 2008
Please Note: This article is to inform your thinking, not lead it. Only you can decide the best place for your money, and any decision you make will put your money at risk. Information or data included here may have already been overtaken by events – and must be verified elsewhere – should you choose to act on it.
Adrian Ash Archive |
© 2005-2022 http://www.MarketOracle.co.uk - The Market Oracle is a FREE Daily Financial Markets Analysis & Forecasting online publication.


