Fiat U.S. Dollar Approaching Resistance In Middle Of Trading Range
Currencies / US Dollar Feb 21, 2013 - 10:13 AM GMTBy: Michael_Noonan
 The best thing about reading developing market activity is that it leads you to a logical conclusion, and when things are not clear, that too, is a logical conclusion, saying: No edge, stay away. Because charts are the visual form of final decisions made by all participants, we are getting the best source for collective thinking about a market's direction. What we get to do is read what message the market is sending.
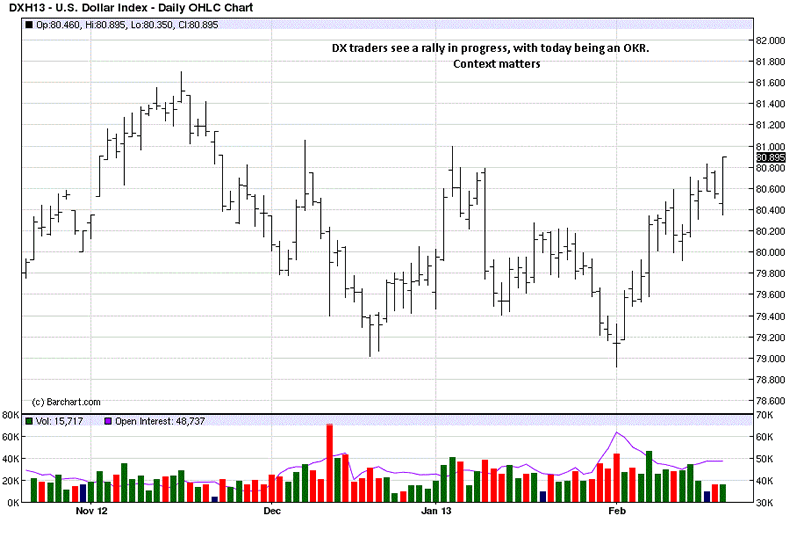
It is always important to put the market into a context. Many traders are eager to "catch the next move," often based upon a myopic view of price behavior. Most who look at charts view the daily and intra day, looking for the next winner, often getting another loser. Here is a current daily:
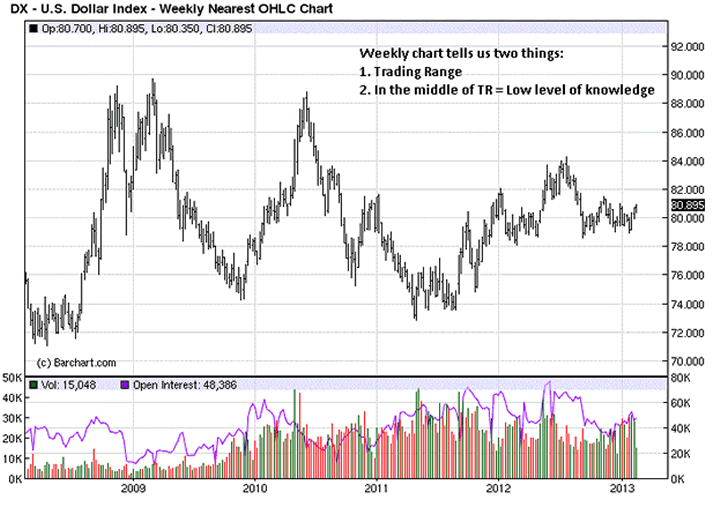
It would seem many are interpreting current market activity as bullish, especially with an Outside Key Reversal, [OKR] day. Looks strong. Looks can be deceiving. Perhaps a look from a different perspective will add to our level of information. The weekly chart puts a larger context of which one needs to be aware.

Why is knowing about the middle of a trading range, [TR], important? The middle of anything says balance, and for a trader it offers the least amount of market information, other than from balance comes imbalance, and it can go either way. 50-50 odds are no better than a coin toss. Are those the kind of odds any trader wants? Not likely, although many accept them.

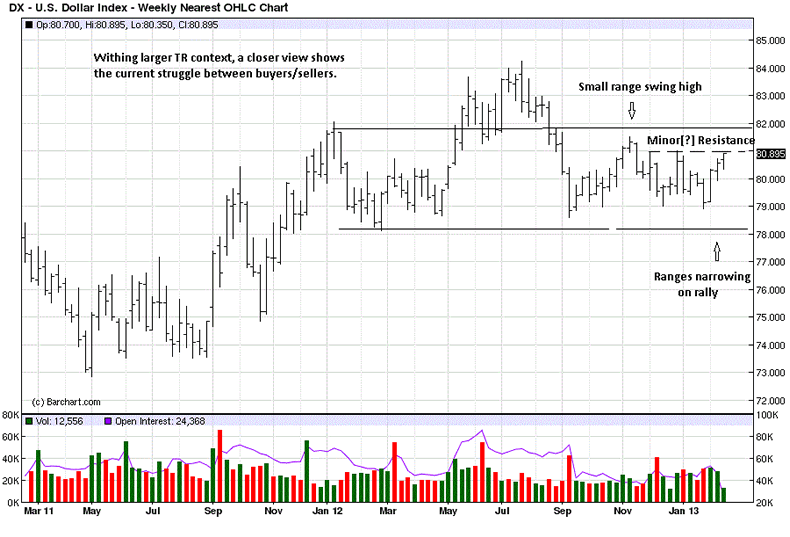
Within the broader perspective, we zoom in for a closer look at current weekly activity. The small range at the last swing high, November 2012, is the market letting us know that demand ran out and supply entered. How do we know? If demand had remained strong, the range would have extended higher. What prevents a demand range from extending higher? Supply overcoming demand. Market logic.
That becomes an important piece of price information, moving forward because we know markets are always testing and retesting support/resistance areas.
Within the TR, we see two previous rallies that failed, and current price activity is back to retest that area, again. So where the first daily chart may have seemed bullish, to some extent, the higher, more controlling time frame is telling us price is at resistance.

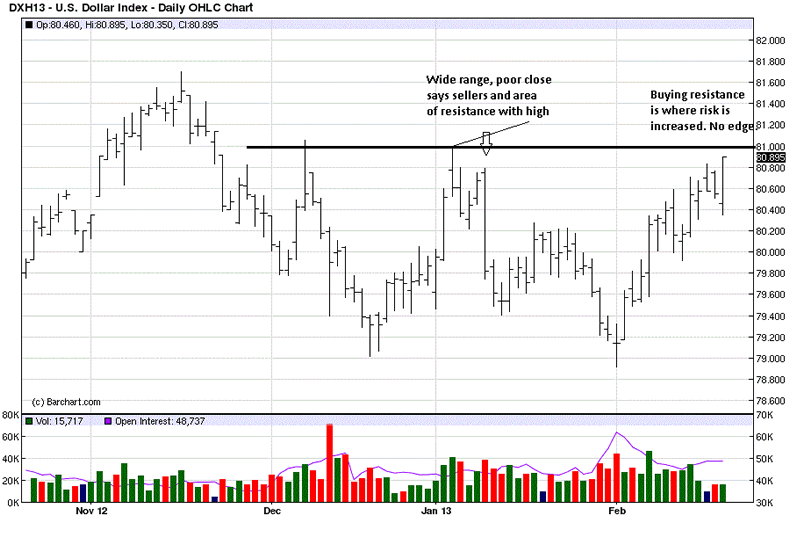
Taking a second look of the same daily chart, we drew in a horizontal line showing where price failed on secondary retests of the earlier November high, and current price is back for another probe. Will it succeed or fail?
We know from the weekly that price is somewhat in balance and can go either way. The daily tells us price is in a short-term rally but bumping up against previously failed areas. One thing we know for sure, money is not made in buying against resistance, and only novice traders buy at resistance, in the unproven belief that it will go higher.
These charts were printed about mid-morning during the trading session, so we have no idea where the close will be, but it will provide additional information from which a more informed determination can be made. In a resistance area, the burden is on buyers to prove themselves.
What we want to know from today's wide range bar is, are buyers going to fail again, or can they build up enough momentum to sustain their effort? Will this be an exhaustion move in an upside feint? There is initial resistance at the 81 area, and then 81.70. The market will let us know by the way in which price responds to each level. The point is to use developing market information to advantage and be in harmony with prevailing forces.

By Michael Noonan
Michael Noonan, mn@edgetraderplus.com, is a Chicago-based trader with over 30 years in the business. His sole approach to analysis is derived from developing market pattern behavior, found in the form of Price, Volume, and Time, and it is generated from the best source possible, the market itself.
© 2013 Copyright Michael Noonan - All Rights Reserved Disclaimer: The above is a matter of opinion provided for general information purposes only and is not intended as investment advice. Information and analysis above are derived from sources and utilising methods believed to be reliable, but we cannot accept responsibility for any losses you may incur as a result of this analysis. Individuals should consult with their personal financial advisors.
Michael Noonan Archive |
© 2005-2022 http://www.MarketOracle.co.uk - The Market Oracle is a FREE Daily Financial Markets Analysis & Forecasting online publication.


