What Will Happen to Gold and Silver Stocks if the Stock Market Tanks?
Commodities / Gold and Silver Stocks 2013 Feb 17, 2013 - 05:57 PM GMTBy: Clive_Maund
 If this is the best that the Precious Metals sector can do when the broad market is rising, as it has been, then what is likely to happen when the broad market drops? This is the question that is, or should be, exercising the minds of investors or would be investors in the sector right now. Today we are going to address this issue head on.
Before we look at the prospects for the Precious Metals sector itself, we are going to examine the charts for the broad market S&P500 index in an effort to determine its course in the months ahead.
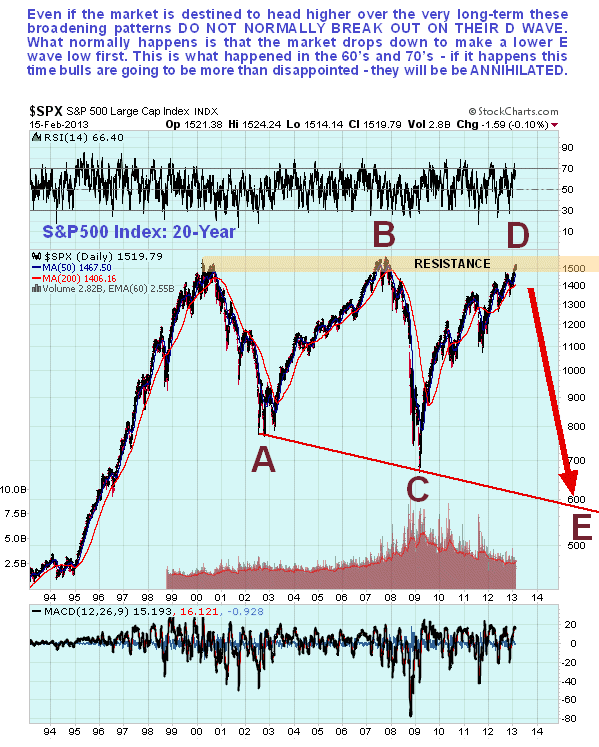
We'll start by looking at a very long-term chart, in order to get a grasp of the big picture. What we find on the 20-year chart for the S&P500 index is that the market is marking out a gigantic flat-topped Broadening Formation. Thus far from the 2000 peak, which marked the culmination of the preceding major bullmarket, the market has marked out 4 clear distinct waves, labeled A to D. The key point to make here is that even if the market is destined to go on to enter another major bullmarket like the one from the mid-70's to 2000, these broadening patterns normally complete with an E-wave that ends below the C-wave trough. Quite clearly, if this is what is set to transpire, then we are looking at one helluva drop from here - and there are various indications that this is going to happen, including the extreme bullishness of newsletter writers, the Smart/Dumb confidence ratio, the VIX and VIX COT etc, which we have recently examined on the site, and of course the fact that the market has arrived at a zone of massive resistance approaching its 2000 and 2007 highs, which is as good a point as any for it to turn down.
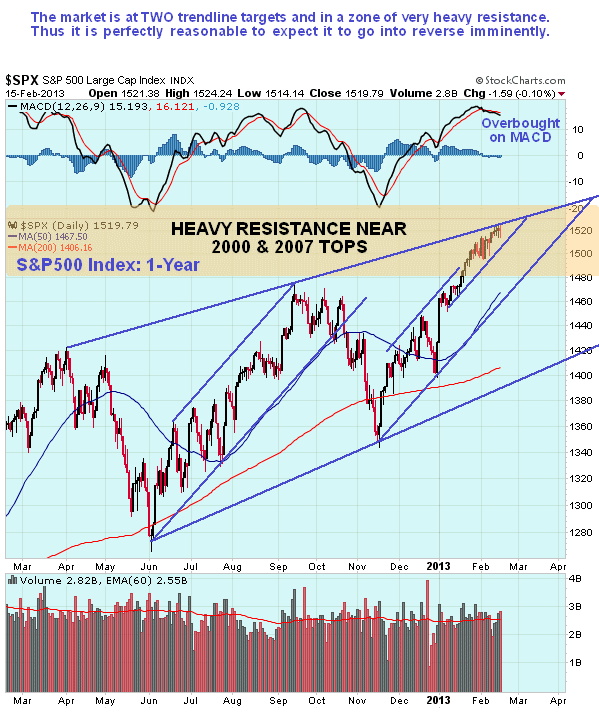
Next we will zoom in to look at recent action in much more detail on the 1-year chart. On this chart we see that in addition to pushing into a zone of really heavy resistance approaching its 2000 and 2007 highs, the index has arrived at two synchronous trend channel targets and is in an overbought state. Thus it looks like we are on the cusp of a significant reversal.
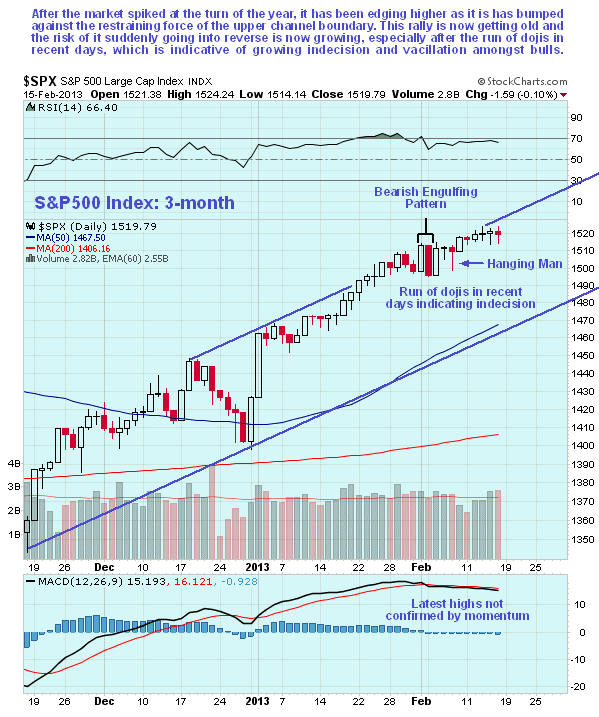
If the market is about to go into reverse, can we see signs of it in recent candlesticks? We certainly can. On the 3-month chart we can see that the market has been bumping up against the upper return line of its uptrend channel since the start of the year. Candlesticks have started to flash warnings this month, beginning with the "bearish engulfing pattern" at the start of the month. Then, just over a week ago, we had a bearish "hanging man" and in recent days we have seen a run of dojis, indicating indecision and vacillation on the part of bulls. While we cannot rule out further gains it is clear that the risk of a reversal is growing fast.
One sure indication that a top is close at hand is the appearance of increasingly absurd and outlandish justifications for higher prices. The sheep will believe anything and the more ridiculous and inflated the story the more they like it. A really good one that has surfaced in recent weeks is that "If Europe collapses the US stockmarket will be the prime beneficiary as hot money flows out of Europe and into the US". Maund comment: there is of course the small matter that if Europe collapses so will its banks, and that is likely to have a nasty knock on effect on the fragile global banking system. Even better is this next one that I read last week - please feel free to burst out laughing when you read this - "As Chinese manufacturing is becoming more expensive, due to rising wages and other costs, manufacturing capacity will return home to the US and drive a new boom in the economy". Maund comment: never mind the fact that if China became prohibitively expensive, capital would simply source other sweatshop production centers like Indonesia, can you visualize John and Judy Lardass heaving their generous posteriors out of their sofa to go and work a 12-hour shift for about $10?? No, I thought not.
Now we come to the core objective of this article, which is to consider what is likely to happen to the Precious Metals sector if the broad market drops. As we have seen above, the broad market may do a lot more on the downside than just turn down and drop or "correct" - it could tank, and if you want a possible fundamental reason for this to occur you should read this highly pertinent and plausible article by Graham Summers WARNING: The EU crisis is back and will only be getting worse, in which he addresses the core problem of the European Union that looks set to bring it down.
In the light of all this, how do the PM stock index charts look right now? - in a word they look terrible.
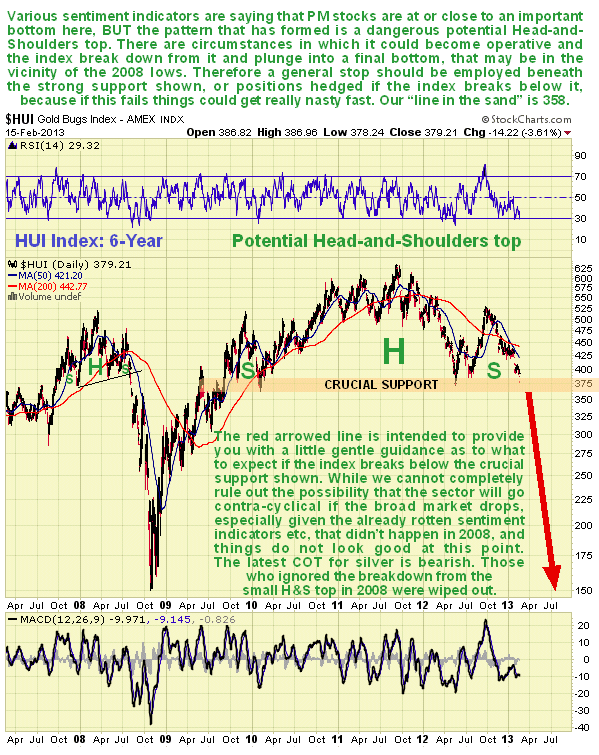
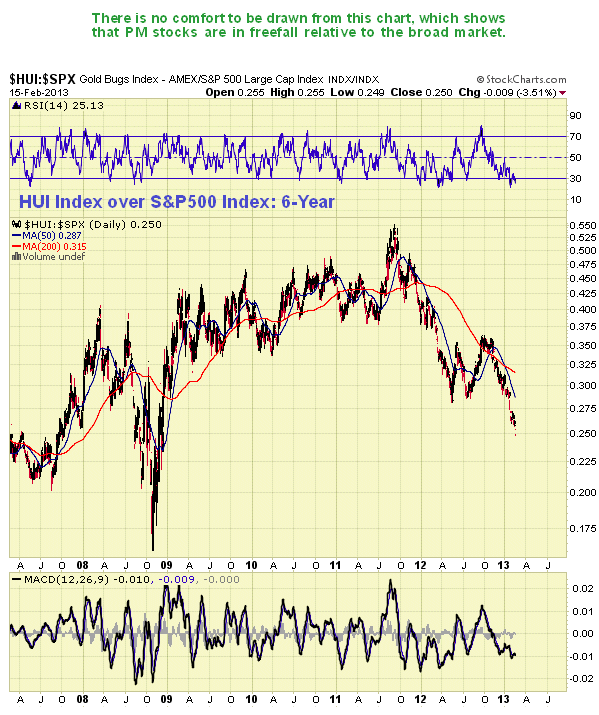
Our 6-year chart for the HUI index shows a massive completing Head-and-Shoulders top. We have observed this menacing pattern for some considerable time, but for a while thought it would abort because of the negative extremes of sentiment already afflicting the sector. However, we should recall from 2008 that sentiment can get even worse as prices plunge precipitously. The relative strength of the sector against the broad market in the recent past has been appalling, and this does not bode at all well for it in the event that the broad market goes into reverse as expected. While we are aware that the sector could go contra-cyclical at any point, as it has traditionally done in the past, and we will always be on the lookout for signs of this happening, at this point it looks like it will be subject to a similar cycle of forced liquidation as in 2008. If the broad stockmarket reverses hard it looks likely that the HUI index will crash the crucial support at the lower boundary of the Head-and-Shoulders top pattern and plunge, with a probable downside target in the vicinity of the 2008 lows, and possibly lower. We have a general stop at 358 on this index and will be out of all remaining holdings in the sector if this fails - we are not going to be caught napping like the unfortunate folks in 2008.
There is no comfort to be drawn from the chart below, which shows that the HUI index is already in freefall relative to the broad stockmarket.
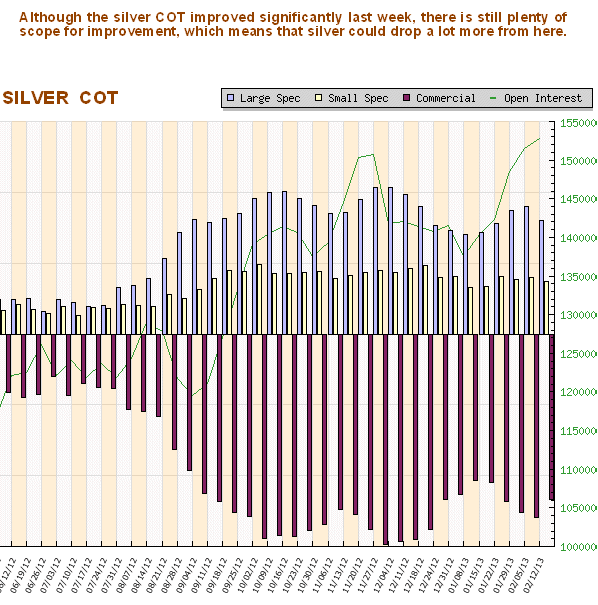
Despite an easing of positions last week, the latest silver COT does not look good at all. It does not support the notion of a big rally soon in silver soon - on the contrary it shows that there is still scope for a severe decline.
Finally, if the broad market does turn down soon and drop hard as expected, it will present the opportunity to make a lot of money on the downside, and on clivemaund.com we are not going to stand around staring vacantly like a flock of sheep while this opportunity passes us by. We are already in Apple Puts, bought at the optimum moment, which can be expected to crater (the stock, not our options) if the broad market plunges, and we will be taking positions shortly in broad market bear ETFs and Puts, probably soon after we see clear evidence of a reversal.
By Clive Maund
CliveMaund.com
For billing & subscription questions: subscriptions@clivemaund.com
© 2013 Clive Maund - The above represents the opinion and analysis of Mr. Maund, based on data available to him, at the time of writing. Mr. Maunds opinions are his own, and are not a recommendation or an offer to buy or sell securities. No responsibility can be accepted for losses that may result as a consequence of trading on the basis of this analysis.
Mr. Maund is an independent analyst who receives no compensation of any kind from any groups, individuals or corporations mentioned in his reports. As trading and investing in any financial markets may involve serious risk of loss, Mr. Maund recommends that you consult with a qualified investment advisor, one licensed by appropriate regulatory agencies in your legal jurisdiction and do your own due diligence and research when making any kind of a transaction with financial ramifications.
Clive Maund Archive |
© 2005-2022 http://www.MarketOracle.co.uk - The Market Oracle is a FREE Daily Financial Markets Analysis & Forecasting online publication.


