


Investing in a Low Economic Growth World
Stock-Markets / Investing 2013 Feb 17, 2013 - 10:42 AM GMTBy: John_Mauldin

 The jury – unless you are the Fed and Ben Bernanke or the Congressional Budget Office, which cannot make lower growth assumptions without really blowing their deficit projections out of the water – is pretty well in on GDP growth: it’s going lower. Ed Easterling and I wrote a recent Thoughts from the Frontline on multiple pieces of research suggesting slower future growth. We asked the question, “So what about stock prices; will they follow suit?” Our thought was that, over time, they would.
Not so fast, says Jeremy Grantham in today’s Outside the Box. He was part of the cabal of researchers suggesting slower future GDP growth whose work we used as the basis for our analysis. Longtime readers know that I think Jeremy Grantham (who heads GMO, which now manages $106 billion – see GMO LLC for more wonderful GMO team research) is one of the smartest men on the planet as well as one of the best investors. With his usual thoroughness, Jeremy makes the case, based on in-house research, that both stock-market returns and corporate earnings growth are negatively correlated to GDP growth. At the same time, he’s not overselling his thesis:
For the record, there is also: a) a moderate relationship between higher-priced countries (on Shiller P/E and price/book) and future underperformance; and b) a tendency for more rapidly-growing countries to be overpriced. Therefore we can deduce a logically appealing (but statistically weak) tendency for overvaluation to contribute a second reason for the market underperformance of more rapidly growing countries. (Please notice how carefully said that is.)
He goes on to reiterate important points he has made over the past few months about the effect of growing resource costs on growth, and then adds:
The main new point I wanted to make was that resource costs are treated like GDP increases. Hence, prior to 2002, steadily falling resource costs were treated as a debit when of course steadily lower costs were a great help to well-being and utility. We calculated that adjusted GDP actually grew 0.2% a year faster than stated. Conversely, since 2000, rising costs were a detriment, not a benefit, as shown in GDP. Treated correctly as a negative, resource costs would have reduced real growth by 0.4% a year. This squeeze on growth will continue as long as resource costs rise faster than the growth rate of the balance of the economy.
Always careful of the ground he stands on, Jeremy then throws in a very important caveat to say:… it is worth remembering that we don’t really know what caused resource prices to spike from 2002 to 2008 so impressively. This was a much bigger price surge than occurred during World War II! Indeed, it may easily turn out that the resource price rises will squeeze future GDP growth substantially more than our estimates.
Or not.
In any case, a careful reading of Jeremy’s work is always instructive. This one is an important think piece, as the direction and magnitude of future GDP growth will be critical as we make business, retirement, and investment decisions. Simply talking past performance is risking your future on the unlikely prospect that the future will look like the immediate past.
I am personally doing a lot of thinking and research on this topic. I strongly suspect that other significant factors will arise to play havoc with projections, in both fantastically positive and uncomfortably dire ways. I am more and more seeing the future as very “lumpy,” that is, quite uneven as to how it will affect individuals and even entire countries. For those who espouse more equality in incomes and outcomes, this is not your optimal scenario. But even with all the “lumpiness,” the average person will be much better off in 20 years – though “average” will cover a much wider spread of outcomes than it does even today. But rather than launch into that book now, we’ll let Jeremy take over.
Have a great weekend. I am enjoying being at home this week. I will be in Palm Springs at the California Resource Investment Conference, February 23-24. My good friend Grant Williams, who writes the blockbuster Things that Make You Go Hmmm… and the Mauldin Economics' Bull’s Eye Investor letter, will be there, as will the best resource investor I know, Rick Rule, along with my favorite data maven, Greg Weldon. There is a full two-day slate of speakers. The event is free to investors and is always fun, and it’s a great time of year to be in California (hate the pensions, love the weather). Come see us! You can read all about it and register at the Cambridge House website.
Your looking forward to catching up this weekend on my reading analyst,
John Mauldin, EditorOutside the Box
JohnMauldin@2000wave.com
Investing in a Low-Growth World
By Jeremy Grantham
This quarter I will review any new data that has come out on the topic of likely lower GDP growth. Then I will consider any investment implications that might come with lower GDP growth: counter intuitively, we find that investment returns are likely to be more or less unchanged – a little lower only if lower growth brings with it less instability, hence less risk. Finally I will take a look at the reaction to last quarter’s letter, specifically about my outlook for lower GDP growth.
Recent Inputs on a Low-Growth Outlook
Some information came out after the 4Q 2012 Letter or was missed by us and is worth mentioning. First, the Congressional Budget Office slashed its estimate of the U.S. long-term growth trend from 3.0% to 1.9%! Given the source and the magnitude of the adjustment, I think it is fair to say that their number is “close enough for government work” to our 1.5%. At least it is within negotiating distance. Next, a report from Chris Brightman of Research Affiliates actually came out a week before ours and concluded that long-term GDP was 1.0%, a number that really corresponds to our 1.5% because his report has no reference to our two special factors, resources and climate, which take our 1.5% to 0.9%. I was encouraged by the solidness of his research. It also led me to an article in the Financial Analysts Journal (January-February 2012) by Rob Arnott and Denis Chaves. Rob has been writing about the effects of age cohorts on investment returns for almost as long a s I can remember, with the central idea that older people are sellers of assets – houses as well as stocks – that younger members of the workforce buy. But they also include the aging effect on GDP growth, which he shows taking a real hit in all developed countries (except Ireland). They are commendably careful in suggesting that their model may be wrong. When or if you read this article, you will certainly hope that it is indeed wrong, for their models estimate from past experience a far greater drop in GDP growth than our work assumed last quarter. And they certainly attacked that aspect in far greater detail than we did. We had included in our report the effect of aging on the total percentage of the population of working age: there are simply fewer workers and more retirees in the distribution. But Rob and Denis (sorry for the liberty) introduce the incremental idea, apparently provable, that older workers lose productivity, no doubt much more in heavy manual work tha n, say, in writing this. But definitely alas, including all activities with dire consequences, they argue for productivity and GDP growth.
Would Lower GDP Growth Necessarily Lower Stock Returns?
This is where I break ranks with many pessimists because I believe theory and practice strongly indicate that lower GDP growth does not directly affect stock returns or corporate profitability. (At least not in a major way for, as we shall see later, there may be some indirect or secondary effects that may very modestly lower equity returns.)
All corporate growth has to funnel through return on equity. The problem with growth companies and growth countries is that they so often outrun the capital with which to grow and must raise more capital. Investors grow rich not on earnings growth, but on growth in earnings per share. There is almost no evidence that faster-growing countries have higher margins. In fact, it is slightly the reverse.
For there to be a stable equilibrium, assets, including entire corporations in the stock market, must sell at replacement cost. If they were to sell below that, no one would invest and instead would merely buy assets in the marketplace cheaper than they could build themselves until shortages developed and prices rose, eventually back to replacement cost, at which price a corporation would make a fair return on a new investment, etc.
The history of market returns completely supports this replacement cost view. The fact that growth companies historically have underperformed the market – probably because too much was expected of them and because they were more appealing to clients – was not accepted for decades, but by about the mid-1990s the historical data in favor of “value” stocks began to overwhelm the earlier logically appealing idea that growth should win out. It was clear that “value” or low growth stocks had won for the prior 50 years at least. This was unfortunate because the market’s faulty intuition had made it very easy for value managers or contrarians to outperform. Ah, the good old days! But now the same faulty intuition applies to fast-growing countries. How appealing an assumption it is that they should beat the slow pokes. But it just ain’t so. And we at GMO have (somewhat reluctantly for competitive reasons) been talking about it f or a few years.
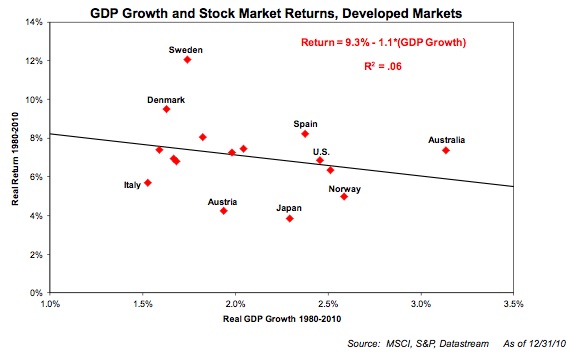
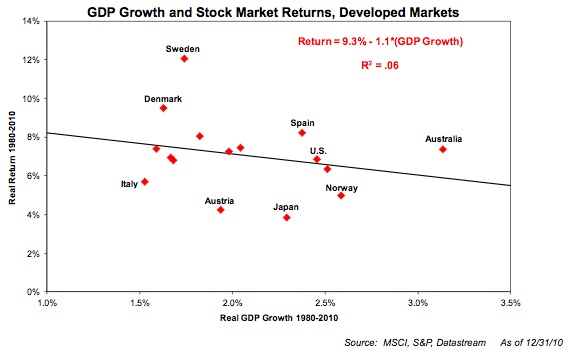
Exhibit 1
GDP Growth Unrelated to Stock Returns
GDP Growth Unrelated to Stock Returns
Exhibit 1, shown by us before, shows the moderately negative correlation between GDP growth by country along with their market returns. This is shown for the last 30 years only and for developed countries only, but in earlier work we went back a hundred years for some developed countries and looked at emerging country equity markets as well and all had the same negative correlations. (See Ben Inker’s white paper, “Reports of the Death of Equities Have Been Greatly Exaggerated: Explaining Equity Returns”, August 10, 2012, at www.gmo.com [registration required].) When I asked my colleague Ben Inker if this was for the same reason that growth companies underperform – that they are overpriced – Ben came up with another completely sufficient explanation (in about 10 seconds): the faster-growing countries, at least for the last 30 years, have simply had more slowly-growing earnings per share. This is s hown in Exhibit 2. For the record, there is also: a) a moderate relationship between higher-priced countries (on Shiller P/E and price/book) and future underperformance; and b) a tendency for more rapidly-growing countries to be overpriced. Therefore we can deduce a logically appealing (but statistically weak) tendency for overvaluation to contribute a second reason for the market underperformance of more rapidly growing countries. (Please notice how carefully said that is.)
Exhibit 2
Earnings Growth Is Negatively Correlated with GDP
Would Lower Real Rates Lower Stock Returns?
Economic theory can’t get everything completely wrong, and perhaps one thing economists have gotten partly right is that the risk-free rate has some relationship to the growth rate of the economy. If that rate approaches zero, there is clearly less demand for new capital; in fact, given accurate depreciation accounting, there would be zero net new capital required. It is also easy to see the risk-free rate settling at something around nil. The risk premium, however, might be little affected. The demand for risk capital – e.g., to replace an old plant, resulting in no new net growth – would still require that the investor expect an adequate return. If it looked likely to be less than that, he would of course withhold his capital until inevitable shortages pushed up profits enough for the corporation to get a satisfactory return, as we have often discussed.
However, and I bring up this complicated issue with trepidation, it does seem possible that in a world with both lower growth and a lower risk-free rate that the risk premium might also drop a little. A lower growth world might plausibly be less volatile because managing a world where the apparent growth is 1.5% (and real growth is 0.9%) is likely to be easier to stabilize than one (as from 1870 to 1995) appearing to grow at 3.4% but actually growing at 3.6%, almost four times higher. (Another way of stating my negative 0.5% resource adjustment, by the way, is to say that the economy’s costs are growing at 1.5% but that its utility – or something closer to utility than GDP anyway – is only growing at 0.9%.) If returns to equity holders are to fall, then P/Es must paradoxically rise to bring yields and total returns down. Yet, as always, equities have to sell at replacement cost. Therefore the books have to be balanced by returns on equity falling. T his after all seems reasonable – if returns on T-Bills drop and returns to stockholders drop, then a system in balance would suggest that returns on corporate investment also drop. This adjustment would likely be modest and should only occur if a lower-growth world were to become less likely, which is far from certain, merely plausible.
Reflections on Our Work on Lower-Growth GDP
With a few months to reconsider the data, old and new, I would have framed last quarter’s issue on declining growth differently to emphasize how routine, even friendly, most of our inputs were. The main new point I wanted to make was that resource costs are treated like GDP increases. Hence, prior to 2002, steadily falling resource costs were treated as a debit when of course steadily lower costs were a great help to well-being and utility. We calculated that adjusted GDP actually grew 0.2% a year faster than stated. Conversely, since 2000, rising costs were a detriment, not a benefit, as shown in GDP. Treated correctly as a negative, resource costs would have reduced real growth by 0.4% a year. This squeeze on growth will continue as long as resource costs rise faster than the growth rate of the balance of the economy. Further, as the percentage of the GDP taken up by resources has recently more than doubled (2002 to 2012), the squeeze on the balance of the ec onomy would also be doubled even if the rate of cost increases stayed constant. Last quarter I estimated that continued increases in resource costs from now to 2050 would lower GDP growth by 0.5%. To prevent that 0.5% effect from accelerating as the share of resources in GDP rises, the rate of resource cost increases must decelerate from the recent 7% a year to a much more modest 2% a year by 2050. (By then, of course, it might well be over the current 7% ... it is just not knowable.) As one can see, this is not nearly as draconian an assumption as it might initially appear to be and in this context it is worth remembering that we don’t really know what caused resource prices to spike from 2002 to 2008 so impressively. This was a much bigger price surge than occurred during World War II! Indeed, it may easily turn out that the resource price rises will squeeze future GDP growth substantially more than our estimates.
Although our low estimate of future GDP growth attracted attention and plenty of opposition, it was only produced as a necessary backdrop to show the potential significance of our two new points: the large deduction for a cost squeeze from resources (0.5%) and a very slight but increasing squeeze from climate damage (0.1 rising to 0.4 after 2030), which latter deduction is considered almost ludicrously conservative by that handful of economists that study the costs of climate change. Our work on the traditional aspects of GDP growth was approached by us as a necessary chore; we were not looking for trouble. Consequently, we tried to keep it simple by using the obvious data sources. “Where on earth did GMO get its pessimistic population data?” ran one complaint. Well, would you believe the U.S. Bureau of Census? And as for productivity, we extended the 1.3% average for the last 30 years out for 30 more years. This is clearly a very friendly assumption give n: a) the recent 1.3% in productivity growth of the last 30 years had declined a lot from its 40-year surge of 1.8% after World War II; and b) the fact that the segment of much higher productivity – manufacturing – has declined to a mere 9% of total labor from 19% in 1980 and continues to decline. Even my one override, -0.2% a year for the next 18 years as a result of much-reduced capital spending, seems, based on econometric modeling, to be a very modest debit. For there to be so modest a negative effect needs capital spending to drift back toward normal in the relatively near future. And even then this -0.2% effect was exactly offset in our forecast by a +0.2% bonus for the unanticipated surge in fracking activity and the ensuing burst of momentarily cheap energy. So why the fuss? The resource debit merely reflects the remarkably odd GDP accounting that counts an unfortunate surge in necessary costs as a benefit, and the remaining 1.5% is merely reflecting recent data . Higher growth assumption, Mr. Bernanke should be aware, must prove longer-term improvements in productivity or, tougher yet, increased labor input.
Short-Term Behavioral Impacts on the Market from Lower GDP
Of course, in the short term there are always temporary behavioral responses. If GDP growth drops unexpectedly, corporations might easily be caught mis-budgeting or overexpanding (although this current ultra-cautious U.S. corporate system, which only reluctantly makes capital investments, is unlikely to be caught out too badly), and perhaps more importantly investors may be shocked by continuous revenue warnings, which might cause the market to sell off. Recent corporate announcements, while usually still claiming exceptional profit margins and generally hitting earnings targets, are increasingly missing revenue targets and issuing future revenue warnings. We must admit, though, that recent revenue warnings have not stopped the market from rising, nor has the unexpectedly slightly negative growth for the fourth quarter GDP.
Within sectors there would quite likely also be a shift in preferences. Growth stocks might seem relatively more attractive: “If the system isn’t growing, the least I can do is pick a few companies that clearly are still growing.” Perhaps quality franchises would also become more appealing with the logic being that at least in the transition to lower top-line revenue growth, competition would become more severe and, hence, defensive moats even more than usually desirable.
Engineered Low Interest Rates
The Fed’s negative real rates regime, designed to badger us into riskier investments in order to push up equity prices and grab a short-term wealth effect (that must be given back one day when least comfortable and least expected), has gone on for a long and, for me, boring time. This low interest rate period is serving, therefore, as a sneak preview of what a permanently lower rate regime might look like (although any permanently lower rates reflecting lower GDP growth would be by no means as low as these engineered rates that we are currently experiencing). So what are some of these effects? The artificially low T-Bill rates first work their way slowly up the curve. Next, the most obviously competitive type of equities – high yield stocks – begin to be bid up ahead of the rest of the market, as has happened. “I’ve just got to squeeze out some higher rates somewhere, anywhere,” is the pension fund plea. Then, this low rate competi tion begins to filter into other securities, historically sought after for their higher yields: higher-grade real estate, where the “cap rates” slowly fall; and, unfortunately, also forestry and farmland, mainly of the larger and more standard varieties that appeal to institutions, which show declines in their required yields, i.e., their prices rise. The longer the engineered rates stay below true market rates, the higher asset prices become until, yes, you’ve got it, corporate assets begin to sell way over replacement cost. Then, if the heart of capitalism is still beating at all, a long period of over-investment begins and returns are bid down and everything moves into balance, often helped along if asset prices get too high, as in 2000 and 2007, by a good healthy market crunch. (This strategy will be seen in future years as archetypical of the Greenspan-Bernanke era: badger and bully investors into taking more risk and eventually pushing assets – houses or stocks or both – far over replacement value, followed eventually, at long and hard-to-predict intervals, by exciting crashes. No way to run a ship, but it does produce an environment that contrarians like us, who can take a few licks, can thrive in.)
Stock Option Culture Messes Things Up
The normal capitalistic response described above runs smack into the new tendency for corporations to either sit on money or buy stock back (regardless of how expensive it may be!), which works in the opposite direction to create shortages, drive prices up, and, as a by-product, lower job creation and GDP growth. So where does this all come out? You tell me. All that I know is: a) if we in the U.S. don’t invest, others will and it will, in the longer run, definitely end badly; b) that even if there is a lower-return world in the future it is still better to own the cheaper assets; and c) it behooves buyers of “cap rate” type assets like real estate to realize that the current low rates are flattered by current Fed policy, which will, like everything else in life, pass away one day, leaving them looking overpriced. It can’t be too soon for me. In the meantime for us at GMO it means emphasizing care and maintaining a heightened sense of value discipline, not only in stock selection, as the whole world is once again bid up over fair value in a way so typical of the post 1994 era, but also in forestry and farmland. GMO has investments in those areas too and recognizes the need to sidestep overpricing by emphasizing the nooks and crannies. Fortunately there are more nooks and deeper crannies in forests and farmland than there are in almost any other area, certainly including stocks.
Danger of the Fed Overestimating Growth
This doesn’t really fit in with a quarterly letter emphasizing important good news, but being about the Fed, I have to make an exception. The Fed appears to be still assuming a 3% growth rate for future U.S. GDP. It would be safer and more confidence-inspiring, now that Bernanke appears to take his responsibility for growth seriously, that he at least have a reasonable growth target (preposterous as that notion is to me that the Fed should or even could affect long- term growth simply by messing about with interest rates). The growth in available man-hours has definitely declined by about 1% a year, yet Bernanke’s assumption for our GDP’s normal trend growth appears unchanged at its old 3%. Ergo, he must be assuming an offsetting rise of 1% in productivity. But why? We should treat these assumptions quite seriously for this is famously (for me) and painfully (for all of us) the man who could not see a 33⁄4-standard- deviation housing market, a nd indeed protested that all was normal, etc., etc., etc. (Dear handful of niggling readers, this 33⁄4-standard-deviation event is calculated on the assumption of a normal distribution, as is often done in investing, even though we [especially at GMO] know this is not true but is just a convenient statistical device. In fact, we at GMO know quite a bit more on this topic for we have studied more or less all assets for as long as we can find data and we have found a remarkable total of 330 “bubbles,” 36 of which we call “major, important bubbles,” which we define as 2-standard-deviation events, given the same assumption. Well, a 2-sigma event should occur every 44 years in a normally distributed world and they have occurred every 31 years. This is much closer to random than we had previously thought. Yes, financial asset data is fat-tailed; that is, there are more outlying events than are found in a normally distributed series, but they are not extre mely fat-tailed. They show up as 2-sigma events but occur as often as 1.8-sigma events would occur in normal distributions. Extrapolating, we can assume that Bernanke’s 33⁄4-sigma housing bubble would occur, adjusted for our fat-tailed real-life history, not every 10,000 years, but somewhere more like 1 in 5,000 years! I previously used “a 1-in-1,200-year event” as a casually selected very large number to describe the 2006 housing bubble. But under challenge, these current numbers are more accurate. No, this does not mean we have 10,000 years of data or even 5,000. It is just statistics, full as always of assumptions, which in this case we hope approach rough justice. What it does definitely mean, though, is that it was extraordinarily unlikely that the extremely diversified U.S. housing market would shoot up like it did and, frankly, even more remarkable that Bernanke and his timid or incompetent advisors could miss it. This is a doubly amazing miss becaus e his and Greenspan’s policy caused this bubble in the first place!) In comparison, his willingness to target an unrealistic 3% level for GDP growth is statistically a microscopic error, a picayune mistake. Unfortunately, though, in the hands of probably the most influential man in the global economic world, it is an extremely dangerous one. I like the analogy of the Fed beating a donkey (the 1% growing economy) for not being a horse (his 3% growing economy). I assume he keeps beating it until it either turns into a horse or drops dead from too much beating! Fine-tuning economic growth, an impossible job for the Fed anyway, is hardly likely to get any easier by badly overstating trend-line growth. It seems nearly certain, therefore, that the Fed will keep trying to whack the donkey for far too long. The likely consequences of this policy are, to be frank, over my head, but my colleague Edward Chancellor will address them briefly if I can nag him effectively.
Investment Implications
Courtesy of the above Fed policy, all global assets are once again becoming overpriced. This reminds me of the idea sometimes attributed to Einstein that a workable definition of madness is constantly repeating the same actions but expecting a different outcome! But, as always, asset prices are not uniformly overpriced: emerging markets and, we believe, Japan are only moderately overpriced. European stocks are also only a little expensive, but in today’s world are substantially more risky than normal. The great global franchise companies also seem only moderately overpriced. Forestry and farmland, which is not super-prime Midwestern, is also only moderately overpriced but comes with our nook and cranny sticker attached. But much of everything else is once again brutally overpriced. Notably, U.S. stocks (ex “quality”) now sell at a negative seven-year imputed return on our numbers and most global growth stocks are close to zero expected return. As fo r fixed income – fugetaboutit! Most of it has negative estimated returns on our data, and longer debt, as always, carries that risk that may be slight in any period, but is horrific if it occurs – accelerating inflation.
When one combines the apparent determination and influence of those who do the bullying with the career risk and short-termism of the bullied and the desire of the general public to believe unbelievable good news, these overpricings can go much further and the Fed can win another round or two. That’s the problem. A clue to timing would be when we begin to hear more passionate new era arguments: profit margins will always be higher; growth will snap back to 3% for the developed world; and new ones I can’t think of ... maybe “when the discount rate is this low the Dow should sell at, perhaps, 36,000.” In the meantime, prudent managers should be increasingly careful. Same ole, same ole.
John Mauldin
subscribers@MauldinEconomics.com
Outside the Box is a free weekly economic e-letter by best-selling author and renowned financial expert, John Mauldin. You can learn more and get your free subscription by visiting www.JohnMauldin.com.
Please write to johnmauldin@2000wave.com to inform us of any reproductions, including when and where copy will be reproduced. You must keep the letter intact, from introduction to disclaimers. If you would like to quote brief portions only, please reference www.JohnMauldin.com.
John Mauldin, Best-Selling author and recognized financial expert, is also editor of the free Thoughts From the Frontline that goes to over 1 million readers each week. For more information on John or his FREE weekly economic letter go to: http://www.frontlinethoughts.com/
To subscribe to John Mauldin's E-Letter please click here:http://www.frontlinethoughts.com/subscribe.asp
Copyright 2013 John Mauldin. All Rights Reserved
Note: John Mauldin is the President of Millennium Wave Advisors, LLC (MWA), which is an investment advisory firm registered with multiple states. John Mauldin is a registered representative of Millennium Wave Securities, LLC, (MWS), an FINRA registered broker-dealer. MWS is also a Commodity Pool Operator (CPO) and a Commodity Trading Advisor (CTA) registered with the CFTC, as well as an Introducing Broker (IB). Millennium Wave Investments is a dba of MWA LLC and MWS LLC. Millennium Wave Investments cooperates in the consulting on and marketing of private investment offerings with other independent firms such as Altegris Investments; Absolute Return Partners, LLP; Plexus Asset Management; Fynn Capital; and Nicola Wealth Management. Funds recommended by Mauldin may pay a portion of their fees to these independent firms, who will share 1/3 of those fees with MWS and thus with Mauldin. Any views expressed herein are provided for information purposes only and should not be construed in any way as an offer, an endorsement, or inducement to invest with any CTA, fund, or program mentioned here or elsewhere. Before seeking any advisor's services or making an investment in a fund, investors must read and examine thoroughly the respective disclosure document or offering memorandum. Since these firms and Mauldin receive fees from the funds they recommend/market, they only recommend/market products with which they have been able to negotiate fee arrangements.
Opinions expressed in these reports may change without prior notice. John Mauldin and/or the staffs at Millennium Wave Advisors, LLC and InvestorsInsight Publishing, Inc. ("InvestorsInsight") may or may not have investments in any funds cited above.
Disclaimer PAST RESULTS ARE NOT INDICATIVE OF FUTURE RESULTS. THERE IS RISK OF LOSS AS WELL AS THE OPPORTUNITY FOR GAIN WHEN INVESTING IN MANAGED FUNDS. WHEN CONSIDERING ALTERNATIVE INVESTMENTS, INCLUDING HEDGE FUNDS, YOU SHOULD CONSIDER VARIOUS RISKS INCLUDING THE FACT THAT SOME PRODUCTS: OFTEN ENGAGE IN LEVERAGING AND OTHER SPECULATIVE INVESTMENT PRACTICES THAT MAY INCREASE THE RISK OF INVESTMENT LOSS, CAN BE ILLIQUID, ARE NOT REQUIRED TO PROVIDE PERIODIC PRICING OR VALUATION INFORMATION TO INVESTORS, MAY INVOLVE COMPLEX TAX STRUCTURES AND DELAYS IN DISTRIBUTING IMPORTANT TAX INFORMATION, ARE NOT SUBJECT TO THE SAME REGULATORY REQUIREMENTS AS MUTUAL FUNDS, OFTEN CHARGE HIGH FEES, AND IN MANY CASES THE UNDERLYING INVESTMENTS ARE NOT TRANSPARENT AND ARE KNOWN ONLY TO THE INVESTMENT MANAGER.
John Mauldin Archive |
© 2005-2022 http://www.MarketOracle.co.uk - The Market Oracle is a FREE Daily Financial Markets Analysis & Forecasting online publication.