


Gold Cycles, Where is he Bottom?
Commodities / Gold and Silver 2013 Feb 16, 2013 - 05:54 PM GMTBy: Ed_Carlson

 Gold has been moving essentially sideways for more than a year since printing a high in August/September 2011. With last week's drop to below the lows of last December/ January many investors must be asking 'where is the bottom in gold?'
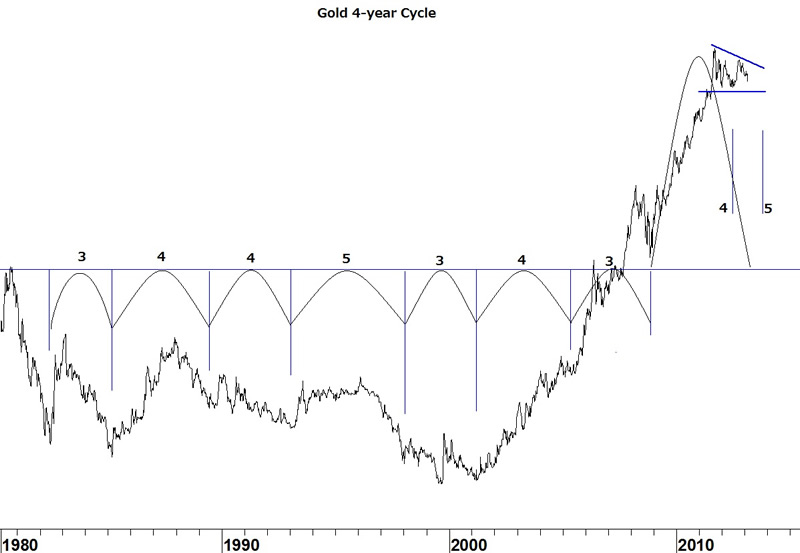
Since 1980 gold has seen a pattern of important lows every 3-5 years. Typically, a long 5-year span between lows is shortened during the following cycle and a short 3-year span reverts back to a four or five year cycle. While the lows of last summer would have made for a nice 4-year, trough-to-trough cycle, the fact that the previous cycle between 2005 and 2008 was only three years implied that the current cycle could expand to something closer to five years. A 5-year cycle would tend to exert downward pressure on gold until as late as this autumn. This gives us a targeted low between now and October.
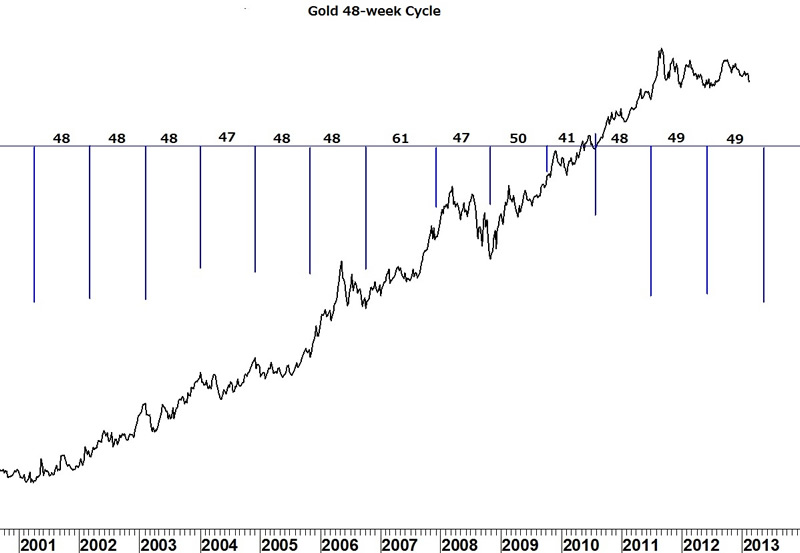
On a shorter time-frame, gold exhibits a 48-week cycle. Since the low in 2001 it has varied between 47 and 50 weeks with one 61-week period in 2007. The next expected trough from a 49-week cycle can be expected in, or near, the week of May 13, 2013.
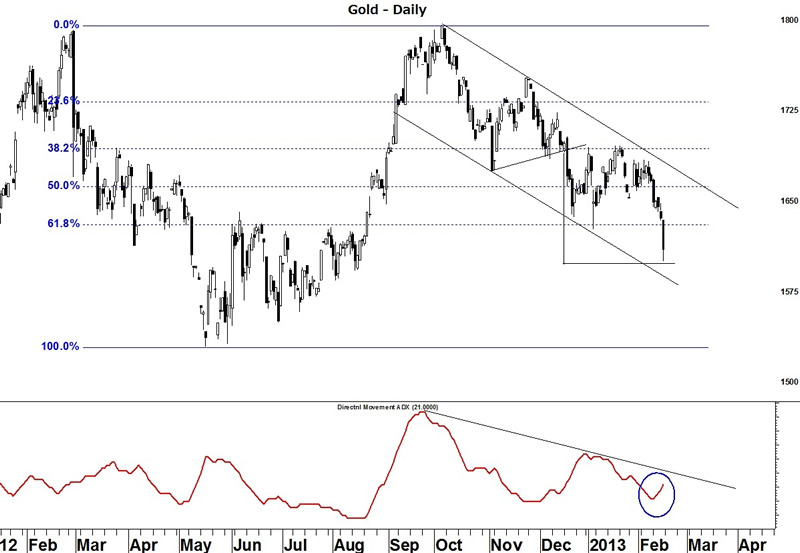
Gold came close to my initial target of 1,595 at last Friday's intra-day low of 1,599.50. This target was based on a triangle which formed inside the trend channel which gold has been trading within since last October. But with Friday's break of the 61.8% retracement level of the May advance, combined with a confirming ADX indicator and 3 months before the expected turn explained above, I suspect far greater losses are in store for gold before a bottom is seen.
Ed Carlson, C.M.T.
A full examination of the current equity market using the methods of George Lindsay including the standard time spans (as well as the Three Peaks and a Domed House and other models) is available. For a free copy of the February Lindsay report, send your request through the SeattleTA website at http://www.seattletechnicaladvisors.com/contactus.html
© 2013 Copyright Ed Carlson - All Rights Reserved
Disclaimer: The above is a matter of opinion provided for general information purposes only and is not intended as investment advice. Information and analysis above are derived from sources and utilising methods believed to be reliable, but we cannot accept responsibility for any losses you may incur as a result of this analysis. Individuals should consult with their personal financial advisors.
© 2005-2022 http://www.MarketOracle.co.uk - The Market Oracle is a FREE Daily Financial Markets Analysis & Forecasting online publication.