


One More Reason for Stock Market Investors to Be Cautious
Stock-Markets / Stock Markets 2013 Feb 14, 2013 - 05:13 PM GMTBy: GrowthStockWire

Jeff Clark writes: There's no sense in being bearish this time of year.
Stocks have a strong seasonal tendency to move higher from January through April. Just look at the action over the past two years as proof. In 2011, the S&P 500 gained about 9% during the first four months of the year. Last year, it gained more than 6% over the same time frame.
As of this morning, the S&P 500 is up nearly 7% so far in 2013... and it looks likely to move even higher. So like I said... there's no sense in being bearish.
But there are plenty of reasons to be cautious right now...
From overbought technical indicators to extreme investor sentiment surveys to the Mother Indicator, there are several reasons to believe that stocks are overdue for at least a modest decline. And if that's not enough to convince you to be careful, here's one more reason...
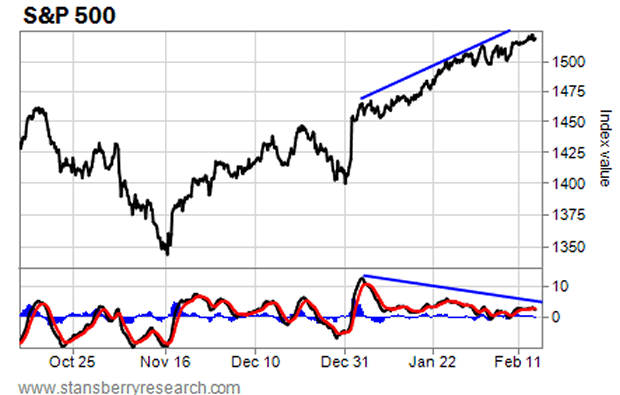
This is a 60-minute chart of the S&P 500. It's useful for monitoring potential short-term movements lasting from a few days to a couple weeks. You can see the steady move higher since the beginning of the year.
You can also see how the MACD momentum indicator (the bottom part of the chart) – which measures the strength or weakness of a trend – has fallen as stocks have moved higher. This "negative divergence" indicates that the momentum behind the rally is weakening, and the current uptrend may be nearing an end.
It's rare for this sort of negative divergence on the 60-minute chart to continue for more than five or six weeks. Either the momentum picks up to add more fuel to the rally or the rally ends and stocks enter a correction.
If you look closely, you can see some mild negative divergence on the MACD indicator starting in late November and continuing for about four weeks. The S&P 500 gave up all those gains in the final two weeks of December.
The negative divergence in place right now is more pronounced. So I suspect we could get an even quicker move lower.
That doesn't mean it's time to sell everything and run for cover... But it is time to be careful. Tighten up your stop losses. Hold off on plowing tons of new money into the market. And maybe buy a few put options to hedge your portfolio.
We still have a couple more months of bullish seasonal influences to look forward to. But as I mentioned on Tuesday – and as the 60-minute chart of the S&P 500 suggests – stocks may be headed for a bit of a rough patch over the next couple weeks.
Best regards and good trading,
Jeff Clark
http://www.growthstockwire.com
The Growth Stock Wire is a free daily e-letter that provides readers with a pre-market briefing on the most profitable opportunities in the global stock, currency, and commodity markets. Written by veteran trader Jeff Clark, and featuring expert guest commentaries, Growth Stock Wire is delivered to your inbox each weekday morning before the markets open.
Customer Service: 1-888-261-2693 – Copyright 2009 Stansberry & Associates Investment Research. All Rights Reserved. Protected by copyright laws of the United States and international treaties. This e-letter may only be used pursuant to the subscription agreement and any reproduction, copying, or redistribution (electronic or otherwise, including on the world wide web), in whole or in part, is strictly prohibited without the express written permission of Stansberry & Associates Investment Research, LLC. 1217 Saint Paul Street, Baltimore MD 21202
Disclaimer: The above is a matter of opinion provided for general information purposes only and is not intended as investment advice. Information and analysis above are derived from sources and utilising methods believed to be reliable, but we cannot accept responsibility for any losses you may incur as a result of this analysis. Individuals should consult with their personal financial advisors.
Growth Stock Wire Archive |
© 2005-2022 http://www.MarketOracle.co.uk - The Market Oracle is a FREE Daily Financial Markets Analysis & Forecasting online publication.