Crash Course In Short Term Gold & Silver Price Forecasting
Commodities / Gold and Silver 2013 Feb 12, 2013 - 11:01 AM GMTBy: GoldSilverWorlds
 With the current uncertain economic and monetary situation, the financial markets are extremely difficult to play. The fundamental case for some “assets” is crystal clear. It should not surprise any reader how strong the case is for physical gold and silver is. Apart from the long term investment, one could also use a smaller amount of his assets to play the ups and downs. As the chart shows, the differences between intermediate tops and bottoms are significant enough to consider shorter term investing, let’s call it trading.
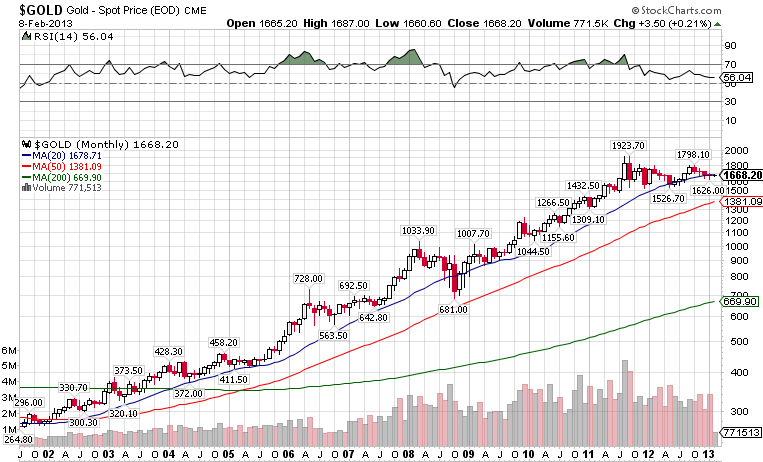
Before going into detail on what to look at when trading, first K. Xeroudakis explained the key principles every successful investor should respect. He is an experienced man who has been mentored by Ted Butler on fundamental analysis, but also was a real risk taker in a private family office, so he knows his domain very well.
1.Most people get in the markets during the worse time, not at the best risk/reward moment.
2.Risk control is very important. Always work with probabilities and prepare for every scenario.
3.Most people cannot controlling their emotions. It is one of the most critical success factors.
4.Be truthful and a truth seeker. Nobody knows the future, so stay humble in your opinions.
5.Educate yourself and keep on learning. Especially in the markets, you must have the same knowledge as your opponents (being the shorts, in case you are long).
Especially this last point about having access to the right knowledge is extremely important. Gold and silver investors must know what the other side of the trade is doing, which is institutions like for instance JP Morgan. If you are looking at the same kind of information, you will make much more better decisions.
The big trading institutions are permanently monitoring futures positions. They use that information for decisions on their own positions.
Futures are a very decisive factor in the short term price setting. So everyone looking to predict short term gold and silver prices, should really know how to read the futures positions, instead of only relying on what others tell (mostly without this information).
The charts in this article are publicly accessible and updated on a weekly basis by Standard Bank weekly reports, to be downloaded every Monday afternoon via Kitco.com. The charts in this article are courtesy of the Standard Bank report from February 4th (latest update at the time of writing).
Gold futures open interest
In order to put things into perspective, the longer term picture is presented in the next chart. It shows the evolution of the gold price and compares it with the open interest in gold futures. Open interest is an indicator of the participation rate: the higher the open interest, the more traders have an open position, either long or short. As a rule of thumb people should know that a higher [gold] price comes with rising open interest while a lower [gold] price is the result of lower open interest.
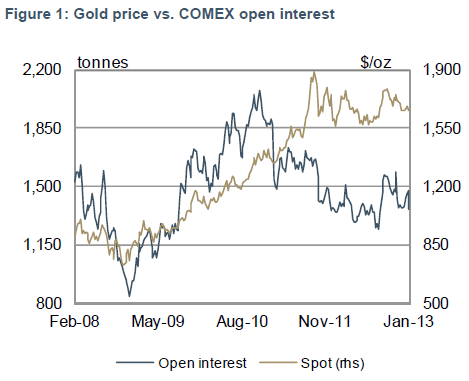
At the beginning of 2009, the open interest was historically low. After a period of declining open interest and lower gold prices, the bottom was hit and both open interest and gold price began rising.
In the summer of 2011, we witnessed a unique moment in history. Hedgers hit the first short covering: open interest did not continue to go up although the price continued rising. The US sovereign debt downgrade urged hedgers to cover their shorts and gold went to all-time highs. When the S&P 500 recovered from its upmove, gold was out of favor.
Today’s situation reveals it is slightly better to go long gold than silver (see silver charts). Again, this applies to short and mid-term trading; it does not tell anything about holding long term physical gold!
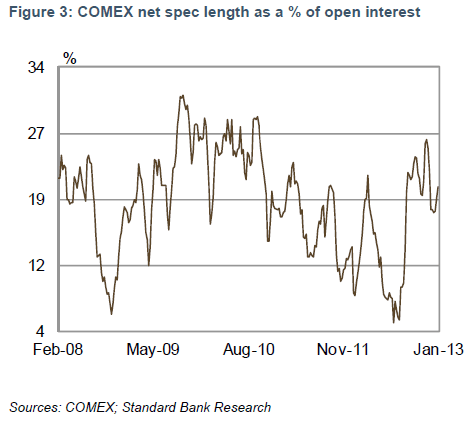
Another important indicator is the number of net speculators, which is indicated for gold in the following chart. It shows the long minus the short speculators. When the net speculators amount to approximately 40% it implies a sell off is likely.
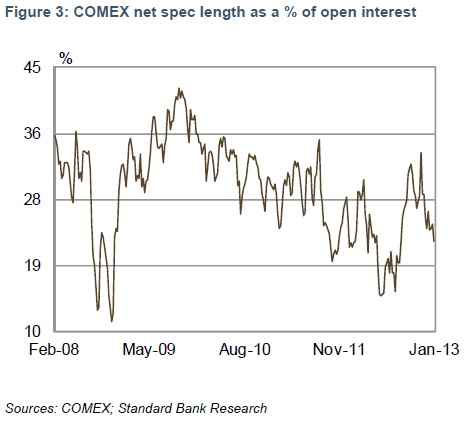
Notice the lows in this charts, right after the financial crash early 2009 and in the 2012 summer. As a rule of thumb, net speculators under 19% implies a full buy signal; it indicates low risk/high reward.
Silver futures open interest
Comparable to the gold chart, historically, silver had low open interests at the beginning of 2009 (minimal interest in the silver market); the hedgers had covered their shorts.
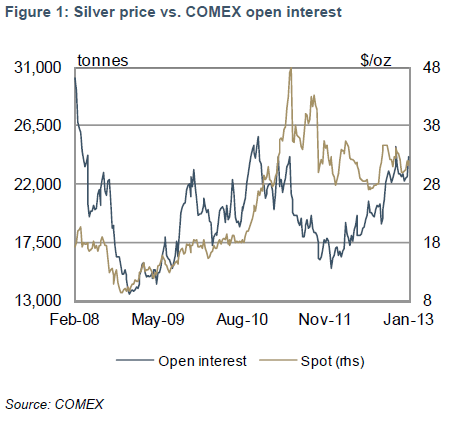
At the beginning of 2011, we witnessed was a historic moment where backwardation occurred. Even during the Hunt brothers peak in 1979/1980 there was no backwardation. Since late 2011, the price has gone up and down with increasing open interest. Currently there is a lot of interest in the silver market. That is the reason why the picture for silver seems not as good as the one for gold. For silver to prepare its move to for instance $60 an ounce, the open interest would ideally be lower. Again the same disclaimer, this tells something about short and mid-term pricing, not long term neither the fundamentals. Also bear in mind that these positions change on a daily basis; so the picture can change drastically even tomorrow. That’s why it is important to keep on monitoring these indicators.
Notice how the evolution of the net speculators indicator has evolved in a comparable fashion for silver as for gold. The big difference is that the movements are much sharper, especially to the downside. The general rule of thumb: below 12% flashes a full buy signal, while the dangerous zone for longs is around 27%.
5-year average
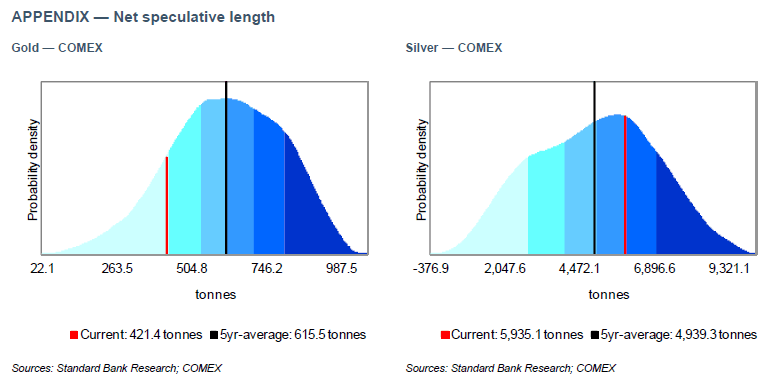
The open interest is one indicator to monitor closely, but the comparison with the 5-year average equally important to monitor. One of those averages is the length of open positions which is shown in the “net speculative length” on the next chart (also freely available in the Standard Bank Research reports on Kitco). The black line shows the 5 year average of the speculators (speculators are the hedge funds in the CFTC reports). The red line shows the current situation: if it is in the deep blue area it means that all hedge funds are net long while in the light blue area means most hedge funds are not involved. The current situation shows that speculators have held 421 tonnes of gold compared to the average of 615 tonnes over the past five years.
These data show that the risk of speculator selling is smaller in gold than in silver. So there is a potential upmove in silver, but these data (which can change on a daily basis) show that the probability for an upmove in gold is higher. On a short term trading basis, gold has a better risk/reward than silver.
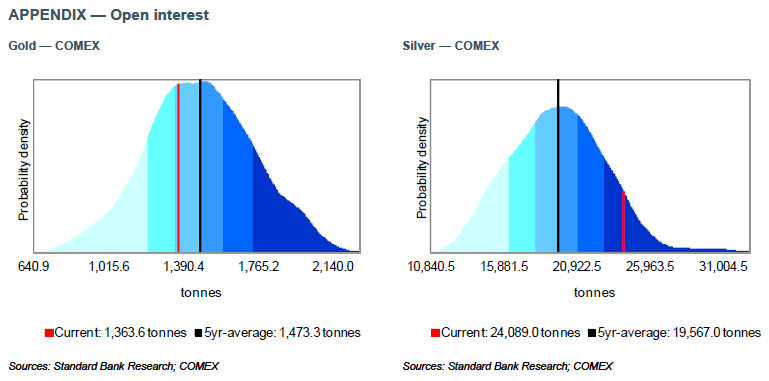
Additional insights can be drawn from the 5-year average open interest positions by comparing them with today’s open interest. Here again, the picture for gold is better than for silver.
These 5 year average open interest figures should be compared with the current open interest rates, as shown in the first silver chart above. Today’s open interest stands at a record 24,089.0 tonnes. For the silver price to move higher, a lower open interest should be expected.
This article is based on an interview with K. Xeroudakis, Precious Metals Strategist and former macro risk taker in a private family owned business. It provides a framework with principles on how pricing is set in the short term. We will publish regularly updates with the latest figures referring to the principles described in this article.
© 2013 Copyright Goldsilverworlds - All Rights Reserved Disclaimer: The above is a matter of opinion provided for general information purposes only and is not intended as investment advice. Information and analysis above are derived from sources and utilising methods believed to be reliable, but we cannot accept responsibility for any losses you may incur as a result of this analysis. Individuals should consult with their personal financial advisors.
© 2005-2022 http://www.MarketOracle.co.uk - The Market Oracle is a FREE Daily Financial Markets Analysis & Forecasting online publication.


