How to Think about Stock Prices in Today’s Volatile Markets
Companies / Investing 2013 Feb 09, 2013 - 01:46 PM GMT Price volatility is an unavoidable aspect of investing in common stocks. During periods when emotions are dominating reason, price volatility can become more pronounced than is normal during calmer times. The insidious part of this fact is that the more volatile stock prices are, the more fear and stress they generate, which only feeds even greater volatility. Of course, the same can be said when greed raises its ugly head. The purpose of this article is to provide some logic and reason that can be applied to stock price volatility that simultaneously weakens its potential damage.
However, in order to accomplish my objective, it is imperative that the reader be willing to consider what I believe is the undeniable reality that stocks are often mispriced by Mr. Market. This concept flies directly in the face of the so-called “Efficient Market Hypothesis (EMH)” accepted by proponents and followers of Modern Portfolio Theory. According to the Efficient Market Hypothesis, stocks are always accurately priced because existing share prices always incorporate and reflect all relevant information. Therefore, stocks are always trading at their fair value. I consider this notion preposterous, and in the context of this article, I intend to offer evidence that clearly disproves it.
Stock Prices are Often Pathological Liars
In his famous work, the Picture of Dorian Gray, Oscar Wilde perhaps said it best when he said “nowadays people know the price of everything and the value of nothing.” Unfortunately, this famous quote may be more appropriately descriptive of stock market investing, than in any other aspect of life. To make my case, all I have to do is direct people to look at most every stock chart, on any financial site or blog, and they will discover a picture solely graphing the company’s stock price movement over whatever time frame is being graphed.
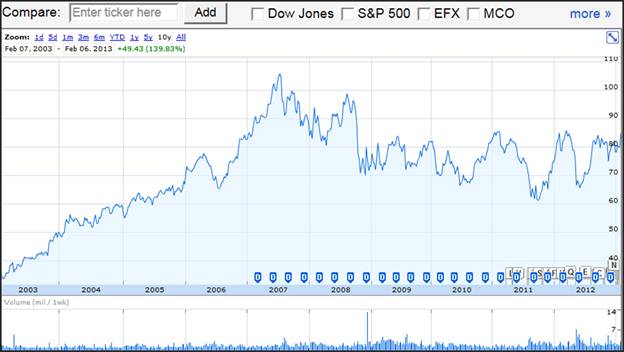
For example, let’s look at a 10-year price only graph on Dun & Bradstreet Corp. (DNB), courtesy of Google Finance. From this picture, it would be very easy to assume that Dun & Bradstreet was a good stock for the first five years on this graph, and a bad stock for the last five years. If you’re talking strictly about the stock’s price, then these assumptions would be rational and correct. For the first five years the price generally trended up, and for the last five years it has generally trended down. Therefore, from this graph we know a lot about the “price” of Dun & Bradstreet the stock, but very little about the intrinsic “value” of Dun & Bradstreet, the business behind the stock. Consequently, I would argue that there is very little wisdom offered by this price graph.
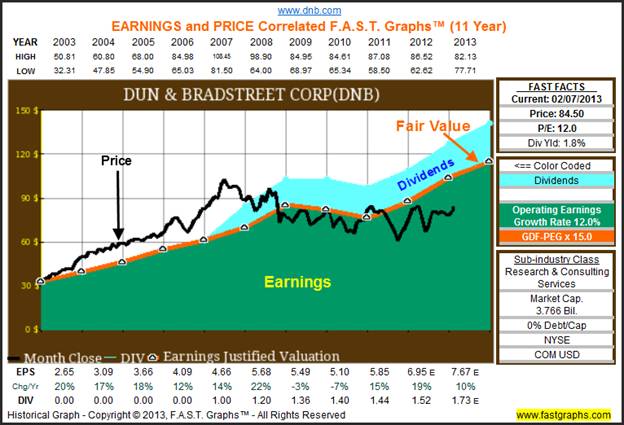
In contrast, if we look at Dun & Bradstreet through the lens of FAST Graphs™, the fundamentals analyzer software tool, over approximately the same time frame, our perspective on Dun & Bradstreet the business and the stock is radically altered. Here, in addition to price only, we have added some essential fundamental information on Dun & Bradstreet. The orange line on the graph plots earnings-per-share at a fair value P/E multiple of 15. The slope of the line, however, is 12%, which is the operating earnings growth rate that the company achieved since 2003. The light blue shaded area represents dividends paid out of the dark green shaded area (earnings).
There are several important facts that we can immediately ascertain and learn about Dun & Bradstreet the business once we have the perspective of price correlated to essential fundamentals (earnings). First of all, we discover that Dun & Bradstreet’s stock was generally being overvalued by Mr. Market for the better part of the years 2003 to 2008. The black monthly closing stock price line was above the orange earnings justified valuation line. Next, we see that the great recession caused the stock price to revert to the mean, thereby, bringing price down into being more in alignment with the orange earnings justified valuation line (intrinsic value).
Furthermore, by focusing only on the orange earnings line, we discover that operating earnings growth was very strong up through 2008, before modestly falling during the recessionary years 2009 and 2010. Then, we discover that earnings rebounded strongly in 2011 and 2012, and are estimated to grow at double-digit rates in 2013. Consequently, we also now discover that based on its recent strong earnings recovery that Dun & Bradstreet appears to be moderately undervalued.
Moreover, the blue shaded area representing dividends tells us precisely when the company reinstituted a dividend policy, and we have a graphic depiction of approximately what percentage of the earnings (the green shaded area) they are currently paying out (the payout ratio). Furthermore, by looking to the right side of the graph we discover that Dun & Bradstreet offers a current dividend yield of 1.8%, and has 0% debt to capital and a current market cap over $3.7 billion.
The point I am trying to express with this Dun & Bradstreet example is how much more wisdom can be gained when you can review a company based on some very basic, and I would argue essential fundamentals, in addition to merely holding an opinion on a company based on stock price action alone. But unfortunately, most investors know the price of their stock, but alas very few know the value of the business behind the stock. I believe this is dangerous, because it can cause people to make very bad decisions based on either fear or greed. In other words, it can cause people to sell when logically they should buy, and buy when they should sell.
How Long Can Mispricing Last
Thus far, I have been developing the undeniable principle that markets will often inappropriately appraise the value of stocks. However, there is a corollary that follows this principle that may be even more important to successful stock investing than the original principle itself. During the times when the market is incorrectly valuing a business, great investors have long understood that inevitably the miss-pricing will correct itself. The following quote by the venerable investing legend Peter Lynch corroborates my position:
"You can see the importance of earnings on any chart that has an earnings line running alongside the stock price. On chart after chart the two lines will move in tandem, or if the stock price strays away from the earnings line, sooner or later it will come back to the earnings." Peter Lynch - 'One Up On Wall Street”
Although my experience has taught me that Peter Lynch is expressing an absolutely true statement, the mystery rests within the words “sooner or later.” Unfortunately, they do not ring a bell on the Stock Exchanges that depicts when tops or bottoms are established. Moreover, it should be understood that when the market is incorrectly valuing stocks, it is simultaneously behaving irrationally. The big problem with irrational behavior is that there is no way to quantify or predict it. Therefore, the investor must rely on faith that dialectic thinking will eventually prevail. But unfortunately, the precise timing when it will correct is unknowable. The following examples are offered to illustrate my case.
Oracle’s Bubble Pricing 1999-2001
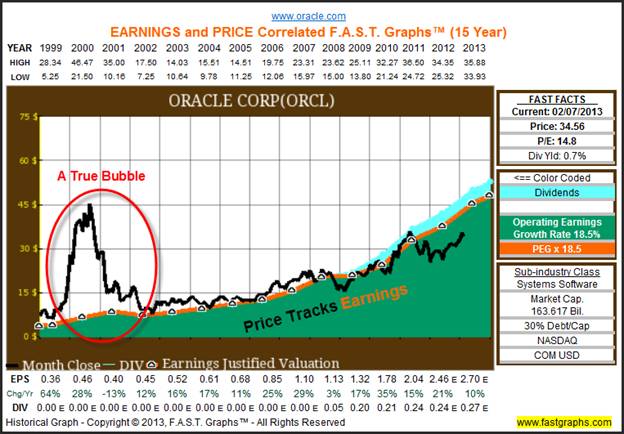
During the time frame 1999-2001, infamously referred to as the irrationally exuberant period for tech stocks, Oracle Corporation (ORCL) represented a classic example of an overpriced bubble stock. As the graph below clearly shows, Oracle’s stock price had radically risen above true worth value (the orange earnings justified the valuation line). In this example, the parabolic rise in price was almost immediately followed by a cataclysmic decline back to value. Therefore, in this first case improper pricing corrected itself rather swiftly.
Furthermore, it’s important to notice how the stock price closely tracked and correlated to earnings during all the other times on this graph. On the other hand, this graph also provides evidence that every time the price did rise above the orange line it soon returned, and when the price fell below the orange line it also soon returned, as Peter Lynch prophesied. Peter Lynch also had this to say about this price behavior:
"A quick way to tell if a stock is overpriced is to compare the price line to the earnings line. If you bought familiar growth companies ... when the stock price fell well below the earnings line, and sold them when the stock price rose dramatically above it, the chances are you'd do pretty well." Peter Lynch - 'One Up On Wall Street”
Consequently, investors armed with a perspective of value are better equipped to make sound decisions, than investors that are relying solely on often pathologically lying price movement. The following quote from Warren Buffett summarizes this point nicely:
"For some reason, people take their cues from price action rather than from values. What doesn't work is when you start doing things that you don't understand or because they worked last week for somebody else. The dumbest reason in the world to buy a stock is because it's going up." Warren Buffett”
Wal-Mart (WMT) Would the Mispricing Ever End?
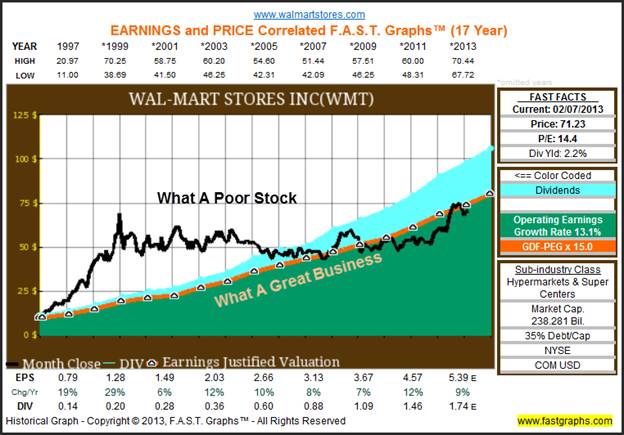
The following price only graph on Wal-Mart provides a very interesting case study of how price can mislead,and how it can persist for a long time. For the first three years on this graph, 1997-1999, Wal-Mart’s stock price behaves in a similar fashion to what we saw with Oracle during those same years, Wal-Mart’s shares had become excessively overvalued. However, this graph clearly shows that for the next 12 years Wal-Mart’s stock price essentially went nowhere. There was plenty of annual volatility up and down, but the long-term trend was basically a flat line. Actually, the first eight years show Wal-Mart’s stock price actually in a steady downtrend (see the red arrow).
What is really confusing, and even misleading about this price only graph, is how it depicts Wal-Mart as a very poor stock for most of this time frame. Therefore, investors relying solely on price action, could easily transfer that picture into believing that Wal-Mart was a lousy company or business. And in fact, there were many people that had a very negative view of Wal-Mart because of that price action. Moreover, again based solely on the price movement, a lot was written about how Wal-Mart was not a very good company. This reflects the insidious nature of erroneous opinion driven by irrational stock market price behavior.
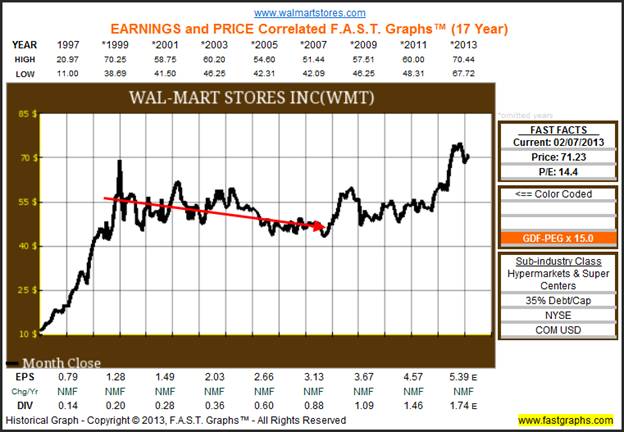
With our next graph, we add Wal-Mart’s business results (the orange earnings justified valuation line) and dividends (the light blue shaded area). If we ignore the black monthly closing stock price line for a moment, and focus solely on earnings and dividends, we see a picture of a very consistent and well managed retailer. In other words, you could not ask Wal-Mart’s management team to provide better results than this graphic illustrates. Year after year, earnings and dividends both increase and earnings growth averages strong and above-average over 13% per annum.
Therefore, I present that Wal-Mart was a great company during this time, but a lousy stock. However, the root cause was Mr. Market’s egregious overvaluing of the company’s shares, and not any fault of Wal-Mart’s business results. Perhaps one could conclude that the stock didn’t drop as quickly as Oracle’s did because people appreciated Wal-Mart’s business more than they should have. This reminds me of one of my favorite definitions of appreciation which states that appreciation occurs when other people appreciate what you own more than you do.
Nevertheless, I believe it is very clear from the graphic below that overvaluation, and not business results are what caused the poor stock performance over such a long time. Clearly, the market was not efficiently valuing Wal-Mart shares from 1999 to mid 2007. On the other hand, I believe it is also clear that the great recession reset their shares, and that stock price has generally correlated to earnings ever since. Of course, we also see shorter-term bouts of improper appraisal (price above and below the orange line) that rather quickly corrects itself.
Fossil Inc. (FOSL) Business Value Cannot Possibly Change this Quickly
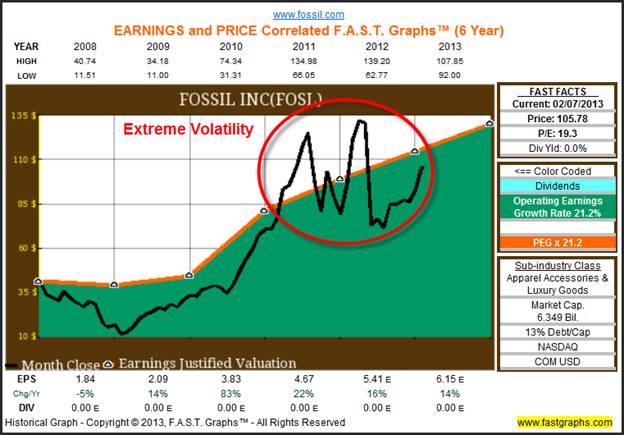
My final example looks at Fossil Inc. a mid-cap specialty retailer of apparel, accessories and luxury goods. The reason I chose this third example is because I believe it clearly reflects and supports the idea that the stock market can misappraise the value of a business over the short run. On the six-year graph we see the stock price falling below fair value, and then moving back to fair value before overshooting it, and then repeating this process again.
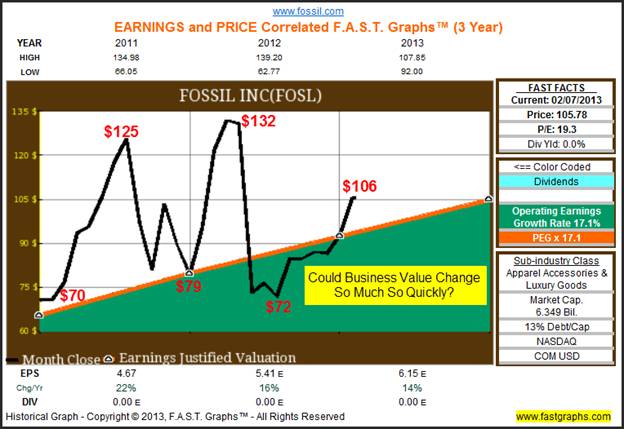
With this next shorter time frame graphic, I ask that the reader focuses their attention on calendar years 2011 and 2012. Clearly, there is a great “disconnect” from the company’s operating history (the orange earnings justified valuation line) and the company’s monthly closing stock price (black line). Earnings have been consistently growing, while stock price has been moving between extreme overvaluation and extreme undervaluation about every six months or so.
The questions begging to be asked are simple and straightforward. Is it even possible that the intrinsic value of the business can vary this much over such short periods of time? Moreover, are these changes with the company’s valuation truly reflecting similar changes with the business? I think the only logical answer to either of these questions is simply an emphatic no.
Based on looking at the company’s operating results, the business is increasing in value at a very steady rate. The stock price, on the other hand, is all over the place, clearly depicting what can only be thought of as emotionally driven and irrational price action. I believe this is clear evidence that the stock market is not always efficient. In fact, I cannot think of any logical explanation that could argue that the stock market was incorporating and reflecting all known information on Fossil Inc. during these two years. Once again, I turn to Peter Lynch and then Warren Buffett for their sage perspectives:
"Just because you buy a stock and it goes up does not mean you are right. Just because you buy a stock and it goes down does not mean you are wrong." Peter Lynch 'One Up On Wall Street”
"I'd be a bum on the street with a tin cup if the markets were always efficient." Warren Buffett”
Summary and Conclusions
I believe there is too much investor focus, and I dare suggest even obsession, with stock price volatility, and far too little attention given to the business behind the stock. Stock price volatility can be, and most often is, very unnerving. Extreme and violent moves in stock price can cause even the most courageous investor to lose their confidence, and therefore once shaken, make poor investment decisions. Warren Buffett provided a great antidote to this problem when he said:
“To invest successfully over a lifetime does not require a stratospheric IQ, unusual business insights or inside information. What's needed is a sound intellectual framework for making decisions and the ability to keep emotions from corroding that framework." Warren Buffett”
I believe the best way for investors to do that is to pay more attention to the business and conduct comprehensive fundamental analysis to ascertain its intrinsic value. Once you have a sound perspective on valuation, then irrational price behavior and volatility can be seen for what it really is. When overvaluation exists, it can rightfully be seen as risk, and when undervaluation exists, as opportunity. In his 1996 Berkshire Hathaway annual report, Warren Buffett also provided us a great insight into the importance of dealing with the strength of the business first and foremost, and stock price only secondarily:
"Investment students need only two well taught courses: - How to Value a Business, and - How to think about market prices" Warren Buffett, 1996 Berkshire Hathaway Annual Report”
Unfortunately, I believe that most investors have this backwards. They most often let stock price movement color their attitudes and beliefs about the investment merit of the stock and even the quality and strength of the business behind the stock. Instead, I suggest that investors once again follow Warren Buffett’s lead as follows:
"Only those who will be sellers of equities in the near future should be happy at seeing stocks rise. Prospective purchasers should much prefer sinking prices." Warren Buffett”
Finally, I turn to the great Mentor of many of the greatest investors that every lived on the planet to include Warren Buffett and Peter Lynch- the legendary Ben Graham, who provided us these following profound bits of Stock Market wisdom:
"The Stock market is always and never rational." Ben Graham
I believe that what Ben Graham is telling us with the above quote is that the current market price of a stock, or the market in general, is continuously adjusting. Consequently, I believe he is also suggesting that the market is always seeking efficiency, is it just doing so between overshooting and undershooting fair value. Therefore, even when it is behaving irrationally, we can, and should, trust that it will sooner or later become rational again.
Therefore, this whole article can be summarized by Ben Graham when he said:
“In the short run, the market is a voting machine but in the long run it is a weighing machine.”
Stock markets are auctions, where people vote their dollars on an hourly and daily basis which causes stock prices to vacillate. Consequently, emotions can and do play a large part into the daily fluctuations of price. However, over time the “weight” of the business behind the stock becomes the ultimate driver of price. In other words, inevitably the market will price a business based on the amount, consistency and growth of the cash flows it is capable of generating on behalf of its stakeholders.
Therefore, I encourage investors to learn how to value their businesses first and foremost, and then behave accordingly based on whether the market is pricing their stocks correctly or not. If excessively overpriced, sell. If excessively undervalued, buy. But never sell a good company just because its price is down, and understand that even the best companies in the world can become overvalued. Exploit folly, don’t participate in it.
Disclosure: Long ORCL at the time of writing.
By Chuck Carnevale
Charles (Chuck) C. Carnevale is the creator of F.A.S.T. Graphs™. Chuck is also co-founder of an investment management firm. He has been working in the securities industry since 1970: he has been a partner with a private NYSE member firm, the President of a NASD firm, Vice President and Regional Marketing Director for a major AMEX listed company, and an Associate Vice President and Investment Consulting Services Coordinator for a major NYSE member firm.
Prior to forming his own investment firm, he was a partner in a 30-year-old established registered investment advisory in Tampa, Florida. Chuck holds a Bachelor of Science in Economics and Finance from the University of Tampa. Chuck is a sought-after public speaker who is very passionate about spreading the critical message of prudence in money management. Chuck is a Veteran of the Vietnam War and was awarded both the Bronze Star and the Vietnam Honor Medal.
© 2013 Copyright Charles (Chuck) C. Carnevale - All Rights Reserved Disclaimer: The above is a matter of opinion provided for general information purposes only and is not intended as investment advice. Information and analysis above are derived from sources and utilising methods believed to be reliable, but we cannot accept responsibility for any losses you may incur as a result of this analysis. Individuals should consult with their personal financial advisors.
Chuck Carnevale Archive |
© 2005-2022 http://www.MarketOracle.co.uk - The Market Oracle is a FREE Daily Financial Markets Analysis & Forecasting online publication.


