Credit Crisis Presents A Great Buying Opportunity?
Interest-Rates / Credit Crisis 2008 Mar 03, 2008 - 08:24 PM GMTBy: John_Mauldin

 This week we look at yet another rather obscure credit market that is in essential lockdown as the subject of your Outside the Box. My London partner Niels Jensen, head of Absolute Return Partners, has written a very interesting piece on the leveraged loan and bank loan markets, which are now upside down and getting more so in the recent weeks. This situation cannot continue, as what are clearly inferior products are selling for more than there high class cousins.
Essentially the sources that bought these loans such as SIVs and highly leveraged funds no longer exist to buy the loans. They have simply gone away and are not coming back. Because many of the funds are being would down through forced liquidations, senior secured loans are selling at a discount to high yield junk from the same company. Until the market digests this overhang, which will take months, Niels points out the opportunities in a distressed market. Like buying a home at auction, while it is not good for the person who lost his home, it means a buyer can get a better value.
I work closely with Niels for years and have found him to be one of the more savvy observers of the markets I know. You can see more of his work at www.arpllp.com . The numbered footnotes are at the end of the letter.)
John Mauldin, Editor
Outside the Box
A Great Buying Opportunity?
By Niels Jensen
Once every few years events conspire to create opportunities which are out of the ordinary and which have the potential to generate extraordinarily attractive returns. Back in March 2004, in this publication, we highlighted one such opportunity. We predicted that oil prices would rise to $100 per barrel from $30 at the time. We willingly admit that we got the timing wrong. It happened even faster than we predicted. We rarely make such bold predictions (it is, after all, a high risk strategy) but once again we see a very attractive opportunity unfolding right in front of our eyes. You may or may not have heard of this 'leverage loan' asset class before. Many investors have not. In this letter we will explore what has happened to this market in recent months, but first, some background.
What is a leveraged loan?
The market for leveraged loans is a close relative of its better known cousin - the high yield bond market. Both are bi-products of the busy private equity calendar of recent years. There are several types of loans in the market today. In the following I will focus on only the highest quality loans - the so-called senior secured loans (also known as first lien loans) which are essentially fully collateralised bank loans provided to companies which have restructured their balance sheets - often in connection with a leveraged buyout [i] . The loans run for 4-5 years, sometimes longer, and are usually priced to yield Libor + 250-300 bps. They are issued at par, they mature at par (barring a default situation), and the typical loan-to-value is less than 50%, so the loans are usually very well protected. In a default situation, equity, high yield bonds, mezzanine debt and second lien debt all stand in front of senior secured loans when the creditors knock on the door.
The loan market has all but collapsed
The loan market has been hit by a sledge hammer, starting in July 2007 and continuing to this day. There are several reasons for this and all of them are related to the ongoing credit crisis.
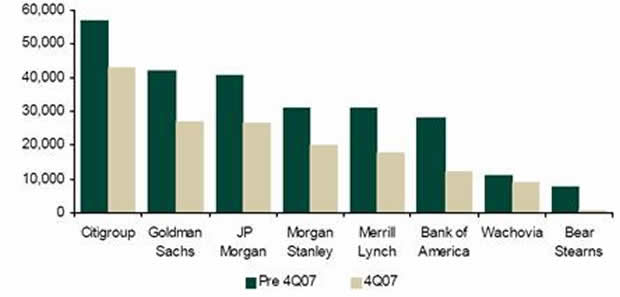
When the first wave of selling hit the loan market last July and August, it was a direct result of the subprime crisis. Almost overnight, investors lost their appetite for risk, and banks were left with hundreds of billions of unsold loans on their balance sheets. According to an estimate provided by Lehman Brothers, when the investment climate changed last summer, US banks had about $300 billion of unsold inventory between them, a number which has now been reduced to $140-150 billion (see chart 1 overleaf). In Europe, the unsold inventory is much lower - about €80-90 billion - a number which is largely unchanged in recent months.
Chart 1: Leveraged Loan Exposure ($ million)
Source: Lehman Brothers
During the second wave of selling in January and February of this year, forced liquidations were the driving force. Hedge funds, in particular, sold out as stricter lending conditions forced them to reduce their gearing. Before the credit crisis began, 4-5 times leverage was the norm rather than the exception for many hedge funds in this strategy. We understand that most have now reduced their gearing to 1-2 times, some even lower. This de-leveraging exercise alone has created tremendous selling pressure.
CLO funds [ii] , which historically have been the largest loan investors, have also liquidated substantial amounts. Many CLO funds, which had accumulated inventory in anticipation of imminent product launches, have been forced to sell out again as they came to realise that the prospects of launching new products in this environment were very bleak indeed. Furthermore, some (mostly US) CLO funds have so-called 'termination triggers' built in which force the fund to be liquidated at certain price levels.
Putting all these factors together, it is not difficult to see why the loan market has fallen out of favour. However, at this point in time, there is no suggestion of deteriorating credit fundamentals. Corporate balance sheets (outside the financial sector) are generally in good shape and the actual default rate on senior secured loans is running at close to zero. It is also noteworthy that loans and high yield bonds have traded more or less in tandem in recent months. If fundamental credit issues had been driving the bear market, high yield would have underperformed loans. It is therefore fair to say that technical and liquidity driven factors rather than fundamental factors have caused the havoc in the loan market.
The effect on loan prices
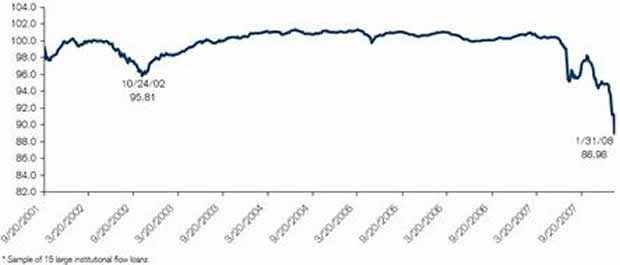
As you can see on chart 2 overleaf, the effect on loan prices has been devastating. The loan market has sold off well beyond the low point of the 2001-02 bear market. As an indication of the magnitude of the sell-off, January 2008 and July 2007 now rank as the two worst performing months in the history of the Credit Suisse Leveraged Loan Index.
Some historical perspective
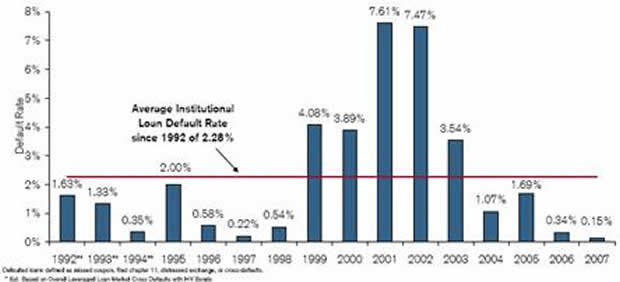
Credit cycles are part and parcel of business cycles. From time to time, companies default on loans. As the economy slows down on both sides of the Atlantic, the default rate will almost certainly start to rise again after a few years with virtually no defaults. Chart 3 overleaf illustrates the default rate on US loans since 1992. As you can see, the default rate has averaged 2.28% [iii] . During the last recession in 2001, defaults peaked at 7-8%.
Chart 2: Bid Prices for a Sample of Large Flow Loans
Source: Credit Suisse
Chart 3: US Leveraged Loan Default Rates
Source: Credit Suisse
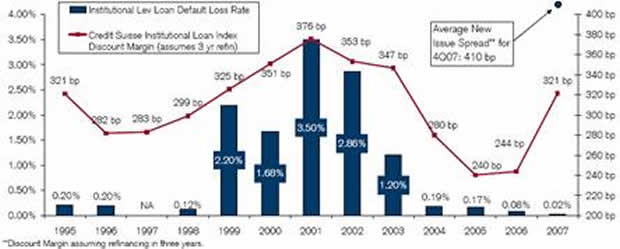
Now, it is worth pointing out that actual losses on loans tend to be much lower than the default rate suggests. As you can see from chart 4 below, losses peaked in 2001 at 3.50% - less than half the default rate - and have been running at close to zero in recent years.
Chart 4: US Leveraged Loan Default Loss Rates v. Spreads
Source: Credit Suisse
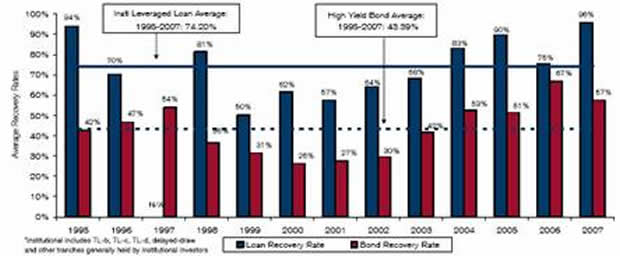
The reason is quite simple. In a default situation, the recovery rate on loans is much higher than on high yield bonds. This shouldn't really surprise you. After all, senior secured loans are first in line in a bankruptcy situation. As you can see from chart 5 below, whereas high yield bonds have recovered only about 43% on average [iv] , the recovery rate on loans has been about 74%. You should also note that the recovery rate actually varies quite a bit from year to year. During difficult times the loan recovery rate tends to drop to about 60%. We have been told that there are reasons to believe that recovery rates will actually be higher in Europe than in the US. The numbers in this chart are based on US data.
Chart 5: US Leveraged Loan v. High Yield Recovery Rates
Source: Credit Suisse
How attractive are loans right now?
Now, given the steep drop in loan prices over the past several months, with most issues currently trading in the mid 80s, loans are now priced at deeply recessionary levels. We estimate that the implied annual default rate is now approaching 15%, suggesting that over 50% of all loans will default over the next 5 years. At ARP we are often accused of being too pessimistic. However, a default rate of this magnitude suggests that we are approaching a recession of almost biblical proportions. The implied default rate is now three times higher than during the savings & loan crisis in the early 1990s which is widely considered to be the worst credit crisis in last 30 years. Do we subscribe to such a bleak view? Absolutely not.
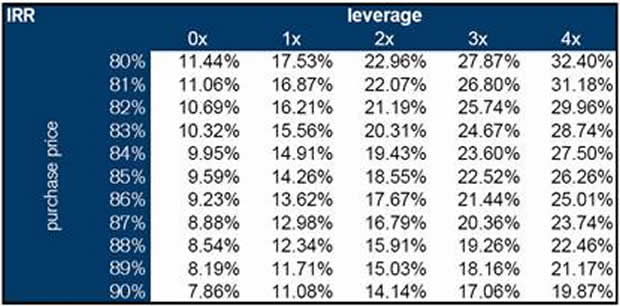
However, we do recognise a good buying opportunity when we see one, and this is one of the better ones we have spotted in a long time. We see this as a truly unique opportunity to pick up very attractively priced assets which have suffered not because of a radical change in the credit environment but because the market has had to adjust to new and tighter liquidity conditions. As you can see from chart 6 overleaf, assuming a recovery rate of 60% (well below current levels but in line with prior recessions), you can now achieve unleveraged returns of 9-10% per annum. We emphasize 'unleveraged' because this is a market that traditionally uses 3-5 times leverage. Until recently, you would need to gear your investment at least 2-3 times to get to 10% per annum. Applying that level of gearing going forward, the expected return is now about 20% per annum. Remember, we are talking about fully collateralised bank debt which is first in line in a default situation. Compare that with the yield on a high yield bond of equivalent quality which is actually quite similar. I certainly know where I would put my money.
Chart 6: Expected Returns on Leveraged Loans [v]
Source: Credit Suisse
Looking through smoke and mirrors
Not everyone agrees with our assessment (if they did, prices wouldn't be where they are). So let's take a moment to look at the bear version of the story - one by one:
Argument #1: Forced CLO liquidations will continue to hurt the loan market. At the peak, as much as 60% of new issues were placed in CLO structures and, despite the large amounts already liquidated, there is a lot more forced selling to come due to the termination triggers.
We say: The total amount of outstanding CLOs with termination triggers is no more than about $12 billion - a relatively modest amount in the bigger scheme of things.
Argument # 2: Given the negative environment, many of the loans currently outstanding will not be easily refinanced and that will drive up the default rate and cause further mayhem in the loan market.
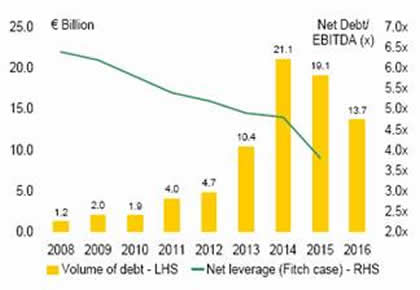
We say: The amortisation schedule for European loans (see chart 7 below) suggests that the next major wave of refinancings does not begin in earnest until 2013. In other words, the market has at least 5 years to sort itself out before we enter the next cycle of refinancings.
Chart 7: Debt Amortisation Schedule - European B-Rated Loans
Source: Morgan Stanley, Fitch Ratings
Argument # 3: The overhang from banks will continue to hurt the market for some considerable time to come.
We say: As illustrated in chart 1, US banks have dramatically reduced their inventory in recent months, and we understand that the trend has continued in January and February of this year (which is not included in the chart). Furthermore, we have evidence of huge cash reserves being accumulated in anticipation of a reversal of fortune for the loan market. It is our prediction that, when this market turns, large amounts of money will seek to enter the loan market, driving up prices quite fast. Meanwhile, European banks treat leveraged loans very differently from their American peers. In Europe these loans are considered par loans and are not marked to market. As a result, there is little pressure on European Banks to sell these underperforming assets.
Argument # 4: The sell-off is not only about technical factors but is also a function of a deteriorating credit environment.
We say: Although we do not disagree that the credit environment is likely to deteriorate in the coming months, it is important to remember that the loan market is a 'Libor +' market. The combination of the Fed's aggressive rate cuts and the normalisation of the Libor curve on both sides of the Atlantic have provided an enormous boost to the companies and may go a long way in offsetting a deteriorating trading environment.
Argument # 5: The economic slowdown will be much more severe this time due to poor lending standards amongst banks in recent years.
We say: The years leading up to the 2001 recession were characterised by extremely lax lending standards with banks willing to lend to technology and telecom companies with virtually no earnings to support the cost of borrowed capital. We are not at all convinced that this slowdown is any worse than the previous one and therefore we do not expect the default rate to be any higher.
It is possible - but in our opinion not very likely - that we are facing something far more serious than an average recession. The world economy is still firing on at least 6 of its 8 cylinders and it would take something truly extraordinary to switch off the global growth engine completely. I have actually spent the last 10 days in Asia where I have been able to observe with my own eyes a very vibrant economy where 'recession' is not even on the radar screen. By far the bigger worry out here is the high food inflation which is making life difficult for hundreds of millions of struggling people who live on very low budgets; however, that is an entirely different story which we may revert to in a future letter [vi] .
In recent months it has become fashionable to take an ultra pessimistic view of the future. These views are presented in total disregard of the fact that deep recessions are very rare and that worldwide recessions almost never happen. The pessimists also ignore the rising dominance of service industries relative to production industries and the weakened position of unionised labour both of which have contributed towards a reduction in the volatility of economic growth in the western world.
More likely, if we get this call wrong, at least in the short term, it will be because our timing is slightly off. The powers of forced selling can be substantial and fundamentals are often disregarded during such periods. However, given the almost complete capitulation in the loan market since the turn of the year, we strongly suspect that we are within striking distance of the bottom and that it is time to start taking this market seriously again.
Footnotes:
[i] Should you want a more detailed description of different types of loans, I suggest you take another look at our December 2006 Absolute Return Letter which can be found on www.arpllp.com .
[ii] CLO funds ("Collateralised Loan Obligations") are structured vehicles where loans are packaged and sold mostly to professional investors.
[iii] We have chosen the US loan market to illustrate the longer term picture because the history on leveraged loans in Europe is relatively short.
[iv] We expect a lower recovery rate on high yield bonds going forward for reasons we explained in our December 2006 letter.
[v] Assumptions: 3 quarters to fully ramped; 4 years to exit; 1% beginning default rate; 5% end default rate; 60% recovery rate; 3.07% LIBOR; LIBOR+260 bps average asset spread; LIBOR+125 bps financing cost.
[vi] You may wish to revisit our June 2006 letter in which we discussed the implications of higher food prices.
Your getting more concerned about the current credit crisis analyst,
By John Mauldin
John Mauldin, Best-Selling author and recognized financial expert, is also editor of the free Thoughts From the Frontline that goes to over 1 million readers each week. For more information on John or his FREE weekly economic letter go to: http://www.frontlinethoughts.com/learnmore
To subscribe to John Mauldin's E-Letter please click here:http://www.frontlinethoughts.com/subscribe.asp
Copyright 2008 John Mauldin. All Rights Reserved
John Mauldin is president of Millennium Wave Advisors, LLC, a registered investment advisor. All material presented herein is believed to be reliable but we cannot attest to its accuracy. Investment recommendations may change and readers are urged to check with their investment counselors before making any investment decisions. Opinions expressed in these reports may change without prior notice. John Mauldin and/or the staff at Millennium Wave Advisors, LLC may or may not have investments in any funds cited above. Mauldin can be reached at 800-829-7273.
Disclaimer PAST RESULTS ARE NOT INDICATIVE OF FUTURE RESULTS. THERE IS RISK OF LOSS AS WELL AS THE OPPORTUNITY FOR GAIN WHEN INVESTING IN MANAGED FUNDS. WHEN CONSIDERING ALTERNATIVE INVESTMENTS, INCLUDING HEDGE FUNDS, YOU SHOULD CONSIDER VARIOUS RISKS INCLUDING THE FACT THAT SOME PRODUCTS: OFTEN ENGAGE IN LEVERAGING AND OTHER SPECULATIVE INVESTMENT PRACTICES THAT MAY INCREASE THE RISK OF INVESTMENT LOSS, CAN BE ILLIQUID, ARE NOT REQUIRED TO PROVIDE PERIODIC PRICING OR VALUATION INFORMATION TO INVESTORS, MAY INVOLVE COMPLEX TAX STRUCTURES AND DELAYS IN DISTRIBUTING IMPORTANT TAX INFORMATION, ARE NOT SUBJECT TO THE SAME REGULATORY REQUIREMENTS AS MUTUAL FUNDS, OFTEN CHARGE HIGH FEES, AND IN MANY CASES THE UNDERLYING INVESTMENTS ARE NOT TRANSPARENT AND ARE KNOWN ONLY TO THE INVESTMENT MANAGER.
John Mauldin Archive |
© 2005-2022 http://www.MarketOracle.co.uk - The Market Oracle is a FREE Daily Financial Markets Analysis & Forecasting online publication.


