Adding Perspective To The U.S. Dollar, Bonds and Stocks
Stock-Markets / Financial Markets 2013 Feb 04, 2013 - 03:31 PM GMT I go back almost six decades and that allows me to compare what I experience now with things I experienced fifty years ago. In the countries I travel in it takes close to US $100 to fill up a gas tank. By comparison I seem to recall that in 1970 I spent US $5.00 to do the deed. I also seem to recall that governments talked about “millions” when they discussed things, and that increased to the hundreds of millions when Viet Nam was in full bloom and Nixon took the helm. Things pretty much stayed that way until Reagan took over and then the term “billion” began to receive attention. Slowly we moved from tens of billions to hundreds of billions as the US moved from the first Iraq war to the second Iraq war in a search for those elusive weapons of mass destruction.
By the time George II was ending his reign we made the jump to “trillions”, and now with Obama we’re talking about tens of trillions. If I’ve learned one thing while living abroad it’s that the more zeros you put after the first number on a fiat currency, the less it means to the people who carry it in their pocket. With respect to the US dollar, I suspect there are few people who can conceptualize one trillion dollars. Therefore I would like to use some space here to see if I can provide some perspective as to what a trillion really means.
Let’s start with the US gross domestic product defined as the total market value of all final goods and services produced in a country in a given year, equal to total consumer, investment and government spending, plus the value of exports, minus the value of imports. If I put a number to this it comes to US $16.4 trillion, and that coincidently is now the amount of the national debt. So another way of expressing the national debt would be to say that every man, woman and child would have to contribute one years work/production at no cost. But hold the boat! We also have another US $65 trillion in unfunded obligations for things like social security, Medicare, Medicaid and so on down the line. These are things we owe, but the government has yet to consider. Finally, the Obama administration is creating new debt at the rate of US $1.2/year in order to pay bills and service old debt.
Projecting out to the end of 2013 we’ll have US $65 trillion in unfunded obligations and the national debt will stand at US $17.6 trillion. Add them up and you have US $83.6 trillion meaning that everyone would now have to contribute 5.09 years of their work/production just to get back to zero. If on the other hand you wanted to grab the bull by the horns and settle up now, every man, women and child in the US could simply write a check for US $278,666.66. I’m a glass half full kind of guy but I just don’t see this happening.
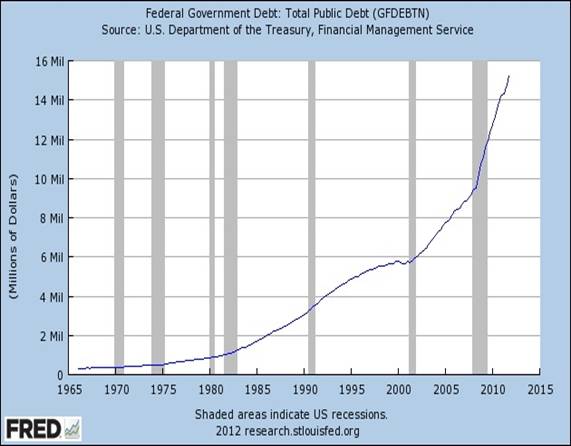
So far I’ve only debt with the Federal government, but the state and local governments aren’t any better. The state and local government debt has risen by 250% just since 2002 as seen here:
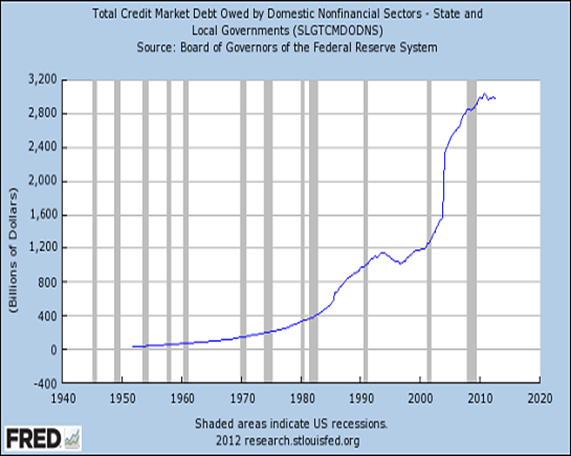
Of course none of this is ever discussed because it’s much easier to use the ostrich approach when dealing with problems.
Now given the socialist bent of the current regime, and looking at past performance, it is entirely possible that the debt could rise another 50% during Obama’s second term. That would put the national debt somewhere around US $25 trillion by 2016. If we had pallets of one hundred dollar bills, this what one trillion dollars would look like to someone standing next to it:
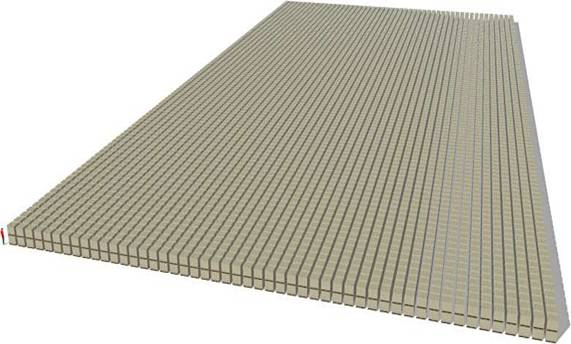
Notice that the pallets are double stacked and the man standing in the lower left hand corner has all but disappeared (literally and figuratively). Now multiply this by 25 and you begin to see the hopelessness of the situation.
Mr. Obama’s only solution is to simply eliminate the debt ceiling and then trust Washington’s good intentions with respect to what is in your best interest. With almost half the population on some sort of government aid, the public would more than likely back him, until the money runs out. Slowly but surely your access to real news will be limited as the governments restricts the flow. The right to carry a gun isn’t the only thing in jeopardy; there are numerous bills pending that will control Internet speech. I for one am convinced that this is what the “Cloud” is all about. They want citizens to collectively put their whole life in one place so Big Brother can put it under a microscope and use it against you.
Everybody talks about growth and how the US is growing again, in spite of a negative growth rate in the fourth quarter of 2012, but it’s all smoke and mirrors. Take out the government spending from GDP and this is what it really looks like:
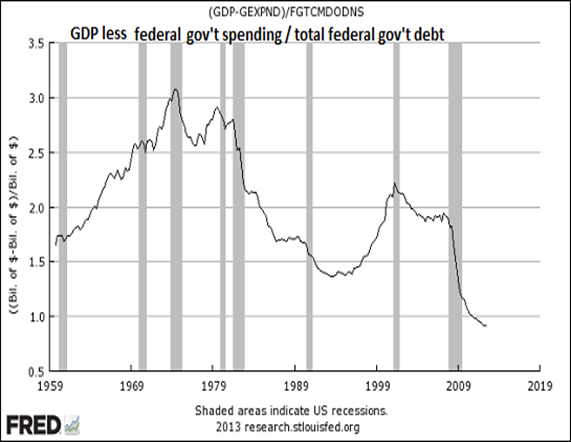
As Federal deficits and debt increased in the 1980s, private GDP was negatively impacted. Only the twin speculative bubbles of the late 1990s to mid-2000s (dot-com and housing) reversed the trend. Once the housing bubble popped, the effect of rapidly rising Federal debt has had a very negative correlation to private GDP.
They get you coming and going! As government borrowing and spending skyrocketed over the last decade, household income flat-lined during the housing bubble and then fell off a cliff once the bubble burst. The State-enforced bailouts of the economy hollowed out household wealth and income. In an obscure welfare system like America's, the cost basis for both enterprises and households constantly rises, pressuring wages lower for the majority of wage earners. We see this here:
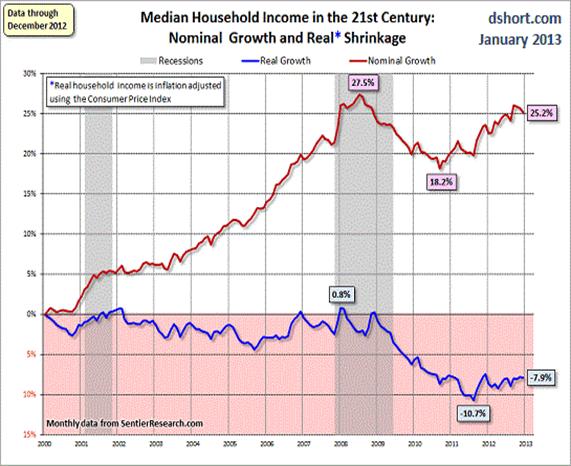
In conclusion we can see that the ballooning government deficit spending and debt have a very real and negative effect on private GDP, money supply, money velocity (not shown) and wages. Printing money does not make us wealthier, nor does borrowing and squandering money on consumption and bad investments make us wealthier. It only serves to enslave us much like the coal companies did one hundred years ago with their company stores. Back then you died of black lung and your family was obliged to pay off the debt. In today’s world your great grandchild will be paying off your debts.
The government would have you believe that you can print all you want, live beyond your means for as long as you want, and you’ll come out smelling like a rose. My experience tells me that in life you have to pay a price for everything. Human nature being what it is today we are willing to sacrifice our freedom and economy for the illusion of security and a hand out. For years other countries were willing to subsidize the US because we bought the goods they produced, but that’s no longer the case. If one is inclined to look you can actually see the effect of the Machiavellian policies currently implemented by the authorities.
The best place to start looking is the US dollar, and there have been some significant developments this week. Take a look at this daily chart of the spot US Dollar Index and then I will expound:
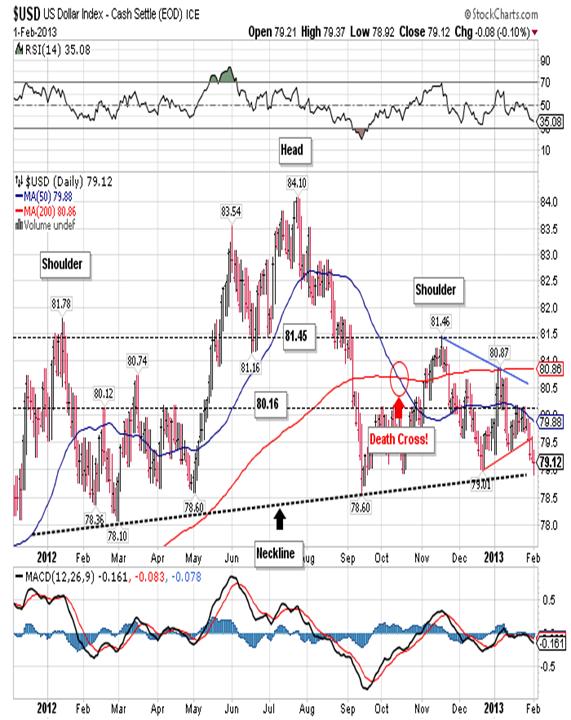
Note that early in the week it broke down through a trend line that connected the December low with the January low. Then on Friday it moved even lower and touched the neckline formed by the large head-and-shoulders formation highlighted in the chart. The US Dollar closed out the week at 79.12 with a session low of 78.92, and you have to go all the way back to September 19, 2012 to find a lower close.
I have know doubt that the US dollar will break down below the neckline, and then it will challenge strong support at 77.93. Later this year I look for the dollar to move even lower and eventually test the all-time low from 2008 at 71.33, and I don’t think it will stop there either. Currently the RSI is not yet in extremely oversold territory (although it’s close) and both MACD and the histogram are pointing lower, so I think we’ll see more downside before there’s any kind of a decent rally. Finally, there is a point out there where foreign central banks will no longer participate in an orderly withdraw from the greenback, panic will enter the market place, and the dollar will free fall. I have three guesses as to where that point can be found: 77.93, 75.45 or 71.33. Personally, I don’t think they’ll wait to see 71.33.
Bonds are another US asset that can’t seem to find a friend, and for good reason. After topping in July 2012 the bonds made an initial decline and then rallied to put in a lower high in November. Since then you can see that the bond has traced out a series of lower highs and lower lows right through to Friday’s close at 142.04:
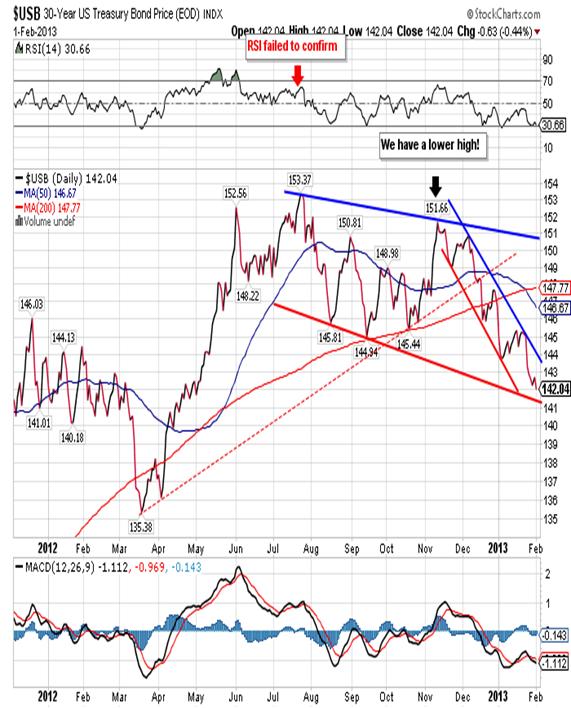
When you look at the chart, and specifically the decline that began with the November lower high, you need to keep in mind that the Fed is purchasing US $85 billion of bonds a month. Then you should ask yourself what happens if and when they stop?
The simple answer is that bond prices would collapse and interest rates would skyrocket. As it is the bond vigilantes are ignoring Fed proclamations to keep rates at zero through 2014, and they are pushing rates higher almost daily:
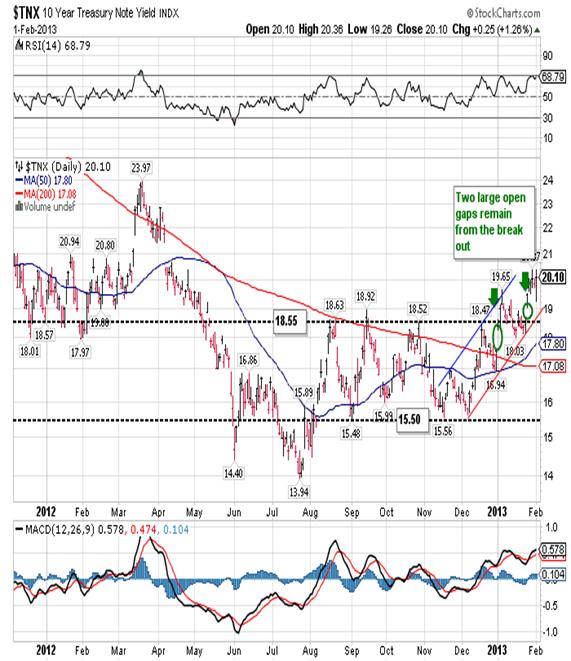
Rates bottomed one month after bonds topped, traded within a range, and then broke out to the upside in early January leaving two large open gaps in the process.
This is the market’s way of sending a message that it is going to take control of the interest rate away from the Fed, and return it to it’s original purpose. Rates are once again becoming a function of risk, regardless of what the Fed, Congress and the ratings agencies have to say. Many are convinced that the Fed will simply buy more, and they will, but that is precisely the problem. If you want the dollar and bond prices to go up, all you have to do is live within your means. It’s as simple as that but no one within the Beltway would consider such a “radical” approach.
Stocks are a completely different animal as the Dow made its first close above 14,000 since October 2007! The Dow closed out the week at 14,009.79 and has left the October 5th closing high in the dust. If you believe that the Dow is a forward looking instrument, and I do, then you have to believe that the Dow sees smooth sailing for the next three to six months. I would believe that to be the case if, and only if, the Dow manages to close above its October 2007 all-time closing high of 14,169, thereby confirming the new all-time highs we’ve seen in the Transportation Index. In the following chart you can see that the Dow doesn’t have far to go:
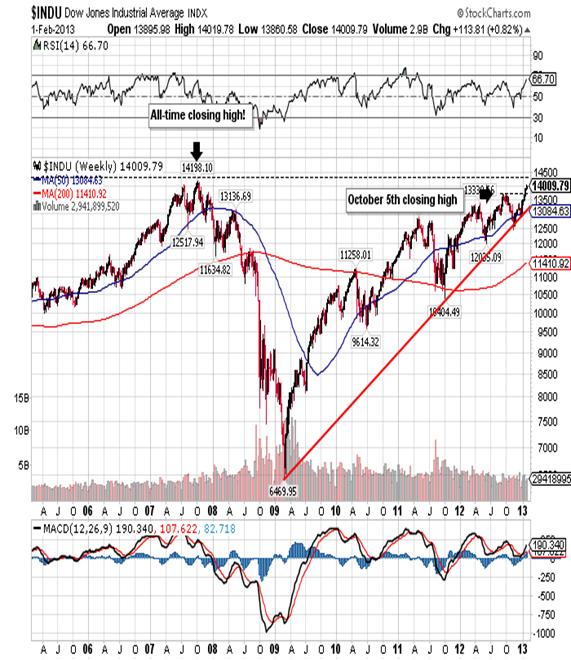
That is not as easy as it sounds though since the Transports have made new all-time highs before, going back as far as 2008, and the Dow just couldn’t seem to get the job done. Here’s what a similar chart of the Transportation Index looks like:
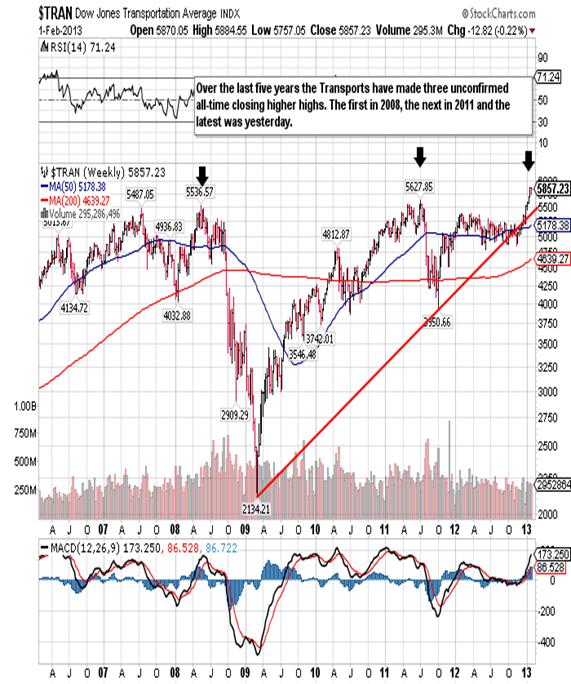
I must say that the current blow-off is impressive as it posted nine consecutive new all-time highs before it finally decided to take a breather early this week. The Transports regained its winning ways on Thursday and Friday and closed out the week at 5,857.23, just 14 points shy of yet another all-time high.
I was long the Dow and took profits at 13,711 and will do nothing unless I see the Dow confirm the Transports. Even if they do both indexes are extremely overbought so I would still wait to see some sort of reaction before going long once again. If on the other hand the Dow turns down without confirming the Transports, I would probably initiate a small short position. Right now I am on the sidelines enjoying the spectacle. You also need to ask yourself where the opportunities would lay if the Dow does confirm? The CRB Index has been trending lower for
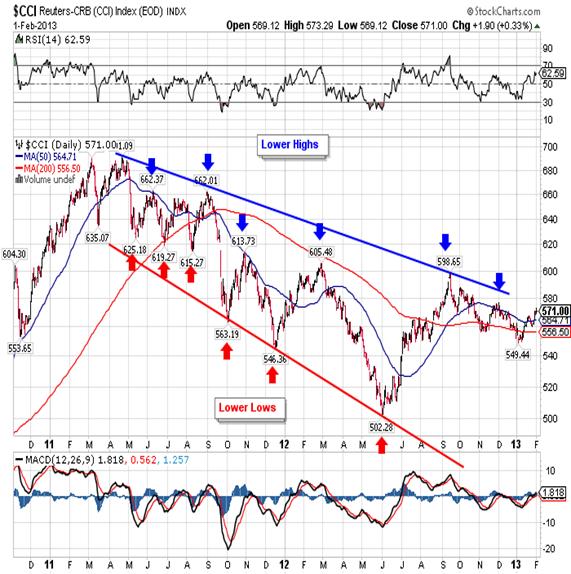
Commodities in general have been on a downward slope since early 2011 and only recently look like they could break out to the upside. If the Dow confirms I think you’ll see the CRB Index break out above 580 and run higher. That’s why I took long positions in copper, cotton, corn and soybeans over the last couple of weeks.
Then we have gold. The yellow metal has been struggling
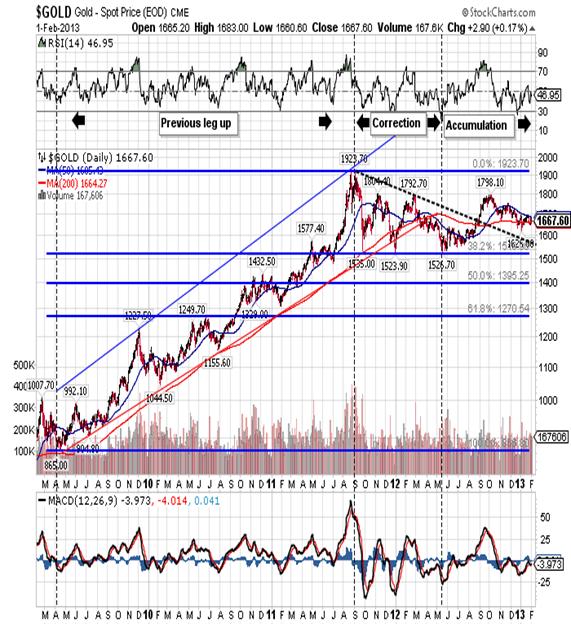
higher as smart money continues to accumulate gold on the dips. Included within the smart money are central banks in Asia and Eastern Europe as they shy away from the US dollar and look for safety. I might add that there’s nothing safer than gold!
This week the yellow metal closed at 1,667.60, up 8.80 for
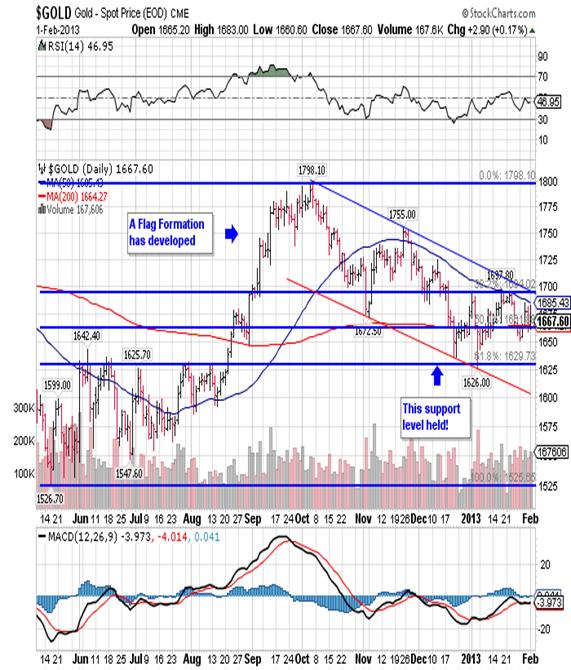
the week and above the 1,661.90 support level. As it turned out Monday’s intraday low of 1,655.00 turned out to be a higher low and that’s what we want to see.
You can also see how gold has traced out a flag formation and I am now looking for it to break out to the upside with a move and consecutive closes above the 1,694.00 resistance. I view this resistance as more important than the psychological resistance at 1,700.00, and once broken we should see an increase in the upside momentum. We continue to see bear raids on gold for no reason, usually just after New York opens for business. This will continue but I now see that each dip is once again finding buyers and sooner or later the shorts will get squeezed. You have central bank buying and it now appears that both Germany and Switzerland want their gold out of the US. Since that gold no longer exists, the Fed will be forced to either buy it back or default.
Excessive Fed printing is creating the perfect atmosphere for gold as worried foreigners opt out of the US dollar and dollar denominated assets. On Friday a senior Chinese official said that the United States should cut back on printing money to stimulate its economy if the world is to have confidence in the dollar. Asked whether he was worried about the dollar, the chairman of China's sovereign wealth fund, the China Investment Corporation, Jin Liqun, told the World Economic Forum in Davos: "I am a little bit worried." He went on to say that, "There will be no winners in currency wars. But it is important for a central bank that the money goes to the right place."
Speaking at the same session, French Finance Minister Pierre Moscovici voiced concern that the Euro was becoming overvalued as a result of quantitative easing and other stimulus actions taken by other nations' central banks. "Certainly, the level of the Euro is high and creates some problem," he said, attributing the single currency's recent gains partly to the return of confidence created by the European Central Bank and euro zone governments in starting to overcome Europe's debt crisis. These types of concerns will only serve to drive investors into the only real money that cannot be created out of thin air, gold! What’s more I think the move higher that most investors have given up on is almost here. I know from the many e-mails I’ve received that a lot of long time gold buyers have given up on the yellow metal, forgetting the lessons learned during the 2008 correction. That tells me I won’t have to wait much longer.
CONCLUSION
There are unintended consequences to just about everything we do in life, but more so when our actions go against the grain. For instance more than a year ago the Swiss National Bank decided that they would devalue the Swiss Franc one way or the other. Since the trend was definitely higher, moving from US $0.549 to US $1.41 over ten years, they felt justified:
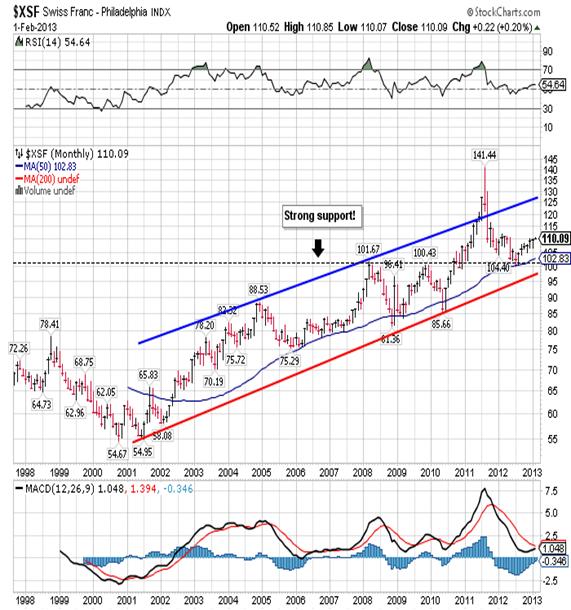
The Swiss National Bank began to print Francs and drove the rate back down to par with the US dollar. Since then the Franc has started to move higher in spite of repeated intervention!
So the Swiss earned a reprieve buy excessive printing and much lower interest rates. That’s the good news. The bad news is that they’ve created a bubble. The Alpine state’s housing market is now in overdrive, and there is speculation that it could be forced to implement restrictions. “We don’t have a bubble in the way that Spain or Ireland did, with double digit price increases year after year. But we have had a boom for 15 years, and at some point things become unsustainable and you get a correction,” says Claudio Saputelli, an economist at UBS. The average price of an owner-occupied apartment in Switzerland has risen 75 per cent in the past decade, according to property consultants Wüest & Partner, fuelled by a combination of high immigration and, latterly, the rock-bottom interest rates to which the Swiss National Bank has committed itself in a bid to stem the appreciation of the franc. Mortgage volumes, meanwhile, are higher than Swiss national output.
So now we are at the intersection of the rock and the hard place. We all know how housing bubbles end. Just ask anyone in Japan or the US. The Swiss National Bank refuses to consider higher rates because that will drive the Franc higher. Under Switzerland’s new rules, the SNB can address such threats by asking the government to force lenders to build up capital buffers worth up to 2.5 per cent of their risk-weighted assets, and economists increasingly believe such a request could be in the offing. “If the market developed as quickly in the fourth quarter as it did in the third, then I would expect [the SNB] to ask the Bundesrat [federal council] to introduce the capital buffers,” says Mr. Saputelli. Other observers take a similar line. “I think a lot of people in the mortgage market are quite nervous about it – they expect to hear every week that the buffers will be introduced,” says Fredy Hasenmaile, head of real estate research at Credit Suisse.
Unfortunately, the Swiss economy has been slowing of late, and its principal trading partners are all struggling, so capital buffers we exacerbate the problem. Finally, while the big banks may be able to handle the increased capital requirements, a number of small banks could suffer. So if a basically sound economy like Switzerland has found itself confined to a Chinese box, imagine the struggles that face a country like France? The current labor minister openly admitted three days ago that the “country is broke”. When you look at the big picture, it’s not hard to see how it all ends.
Robert M. Williams
St. Andrews Investments, LLC
Nevada, USA
Copyright © 2013 Robert M. Williams - All Rights Reserved
Disclaimer: The above is a matter of opinion provided for general information purposes only and is not intended as investment advice. Information and analysis above are derived from sources and utilising methods believed to be reliable, but we cannot accept responsibility for any losses you may incur as a result of this analysis. Individuals should consult with their personal financial advisors.
© 2005-2022 http://www.MarketOracle.co.uk - The Market Oracle is a FREE Daily Financial Markets Analysis & Forecasting online publication.


