


Stock Market Broadening Top Pattern Meets the Inflation Mega-trend
Stock-Markets / Stock Markets 2013 Feb 03, 2013 - 02:19 AM GMTBy: Nadeem_Walayat

 The Dow having successfully breached the psychologically important 14k on Friday, an event that has triggered the mainstream media to busily dig out long-term charts for analysis that show that the market is approaching a multi-year high that is coupled with dubious concluding implications.
What do you see when you look at the long-term Dow Chart?
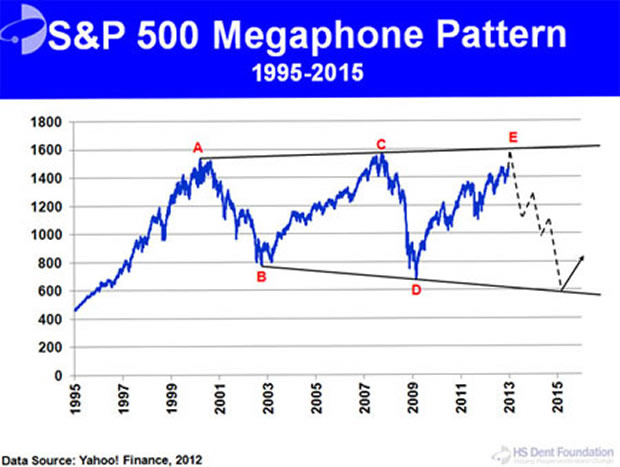
The consensus view as illustrated by popular market commentators such as Harry Dent, is that the price action resembles that of an broadening stock market megaphone pattern which implies that a severe bear market imminent as illustrated below from Harry's recent article - Harry Dent: Stock Market Roller Coasters and Bear Megaphones
Looking at the same chart through my own perception which is born out of pain and gain rather than academia or journalism. I see two key things, first a series of clearly defined trending significant bull and bear markets that collectively comprise a high volatility trading range, so the market has been exhibiting high volatility.
And secondly an 15 year exponential inflation and technologically wealth creating coiled spring that is ultimately being primed to propel the stock market to the next higher equilibrium level, just as occurred during previous similar periods such as the 1930's and 1970's.
Whilst I don't see it as my job to analyse the performance of other market analysts. However, as we have convergence of interests here in which respect Harry Dent forecasts that the stock market rally will fizzle out during January and the stock market will likely crash by 30% to 50% (see Bloomberg video).
Only one problem - The video's dated 31st Dec 2011 and the forecasts are for 2012!
"I think the S&P 500 Is going to go down 30% to 50% in 2012 alone and I don't think that will be the bottom. This is going to be a replay of 2008 to early 2009 over the next year or two.".... Harry Dent - 31st Dec 2011.
The message of this analysis is that of building upward inflationary pressure that stocks are leveraged to, and that increased volatility has made the stock market less susceptible to speculative interest, i.e. the stock market is perceived as being far more risky as investors viewing the market today perceive it in terms of the preceding 2 peaks and the subsequent deep troughs, then if it had slowly trended from 6000 to 14000 during the past 15 years, which fits the bill for a stealth bull market that is likely to stealthily break to and build on new highs.
At this point the market has one of two possibilities -
1. Remain within the trading range (plus/ minus a few hundred points) and target a severe bear market.
2. Break the last high and target a new sustained bull market phase far beyond of that which can be perceived at this point in time.
In my opinion the 2nd outcome is by far the most probable as a consequence of time, i.e. the longer the sideways trend then the greater the probability for a breakout inline with the expectations born of an exponential inflationary mega-trend and dissipation of speculative interest due to perceived uncertainty inherent in the mega-trend price pattern i.e. the price pattern of the past 15 years is inherently UNSTAIBALE - This instability breeds STABILITY ! Because the more certain a trend is the LESS likely is it to transpire.
Instead as in my chart above shows that if the Dow had trended in a smooth trend to 14k then that would be inherently UNSTABLE for a speculative markets because most of the people CANNOT be right most of the time!
The bottom line is that you do not want to see very stable price patterns for the stock or any other speculative market. You want the pattern to be marginal to be near 50/50, because most people tend to opt for what is easiest to perceive, much as everyone experiences gravity that pulls everything down to the ground, but instead what everyone fails to comprehend (including scientists) is that gravity is pushing everything away from everything else which is THE universal mega-trend - INFLATION and not just that but that the Inflation Mega-trend is EXPONENTIAL!
Yes, I know, we will have to wait for Einstein's theory of relativity to be debunked at some future date, but the Universe is expanding in all directions (Big Bang origins), which suggests that we do not fully understand the nature of Gravity, what is a pulling force in our plane of existance, is a pushing force on other scales of existance.
If you think this is nonsense, then ponder that the academic scientists believe that most of the matter in the universe is dark matter that they just cannot see or measure, it is what they use to confirm the inter-galactic behaviour they observe. Instead rather than dark matter it is more probable that gravity pushes as well pulls!
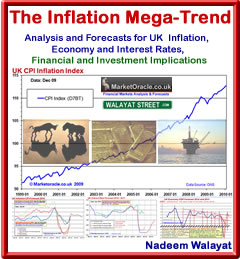
Concerning Inflation, I won't repeat what I have written to near infinite length before, just let the below graph speak for itself.
This also explains why academic economists will always get it wrong because they always perceive their data in terms of smooth certainty i.e. that the economy will grow by 2% this year, 2.5% next, 3% third year, or as the Bank of England often repeats that Inflation will converge to 2% in 2 years time - Which NEVER HAPPENS! Because they have no concept of how trends actually work, if they did they would realise that the smooth certainty of their implied forecasts virtually guarantees that it will FAIL. Instead seek to evaluate the most extreme probabilities of outcomes, to arrive at the most probable and not the smooth curve fits. The same holds true for trading, the more extreme the price action the more valuable it is in terms of profit - See the real secrets for successful trading.
This analysis forms a sub component of Part 2, that imminently aims to resolve towards a detailed trend forecast for the Dow (DJIA) for the whole of 2013 and possibly beyond. Part 1 (Going Beyond the Proton Gradient -87 Stocks Stealth Bull Market Analysis 2013 ) - Dealt with the broader drivers for stocks and financial markets such as answering the question how can the stock market keep going higher .....?
Ensure you are subscribed to my always FREE Newsletter get what is turning out to be very extensive analysis (even by my standards) and high probability trend forecast for the stock market for 2013 in your email in box over the next few days.
Source and Comments: http://www.marketoracle.co.uk/Article38807.html
Nadeem Walayat
Copyright © 2005-2013 Marketoracle.co.uk (Market Oracle Ltd). All rights reserved.
Nadeem Walayat has over 25 years experience of trading derivatives, portfolio management and analysing the financial markets, including one of few who both anticipated and Beat the 1987 Crash. Nadeem's forward looking analysis focuses on UK inflation, economy, interest rates and housing market. He is the author of three ebook's - The Inflation Mega-Trend; The Interest Rate Mega-Trend and The Stocks Stealth Bull Market Update 2011 that can be downloaded for Free.
 Nadeem is the Editor of The Market Oracle, a FREE Daily Financial Markets Analysis & Forecasting online publication that presents in-depth analysis from over 600 experienced analysts on a range of views of the probable direction of the financial markets, thus enabling our readers to arrive at an informed opinion on future market direction. http://www.marketoracle.co.uk
Disclaimer: The above is a matter of opinion provided for general information purposes only and is not intended as investment advice. Information and analysis above are derived from sources and utilising methods believed to be reliable, but we cannot accept responsibility for any trading losses you may incur as a result of this analysis. Individuals should consult with their personal financial advisors before engaging in any trading activities.
Nadeem Walayat Archive |
© 2005-2022 http://www.MarketOracle.co.uk - The Market Oracle is a FREE Daily Financial Markets Analysis & Forecasting online publication.