


Lindsay Stocks Bull Market Top Forecast 2013
Stock-Markets / Stock Markets 2013 Jan 29, 2013 - 11:54 AM GMTBy: Ed_Carlson

 When forecasting a market high with the methods of George Lindsay, the first step is always the 15-year interval. A period of time which should contain the high we seek is identified by counting from an important low to a time period 15 years to 15 years and 11 months later. Counting from the low of October 1997 identifies such a time period between October 2012 and September 2013.
After the bull market high in October 2007 the Dow declined for 13 months, until November 2008 when it marked a temporary low. The Principle of Continuity directs us to count the next advance from this “secondary low” rather than the ultimate low in March 2009 as 13-14 months is the time span of a long basic decline. A complete listing of Lindsay’s standard time spans can be found at Seattle Technical Advisors.com. We always begin counting the next basic advance from where the previous basic decline ended.
Counting from a descending middle section in January 2005 to the bull market high in October 2007 is 1002 days. The July 2, 2010 low follows the 2007 high 995 days later making this the bottom of a basic cycle. We would expect to count a basic advance from this low which means the advance from the November 2008 low must have ended at the April 2010 high.
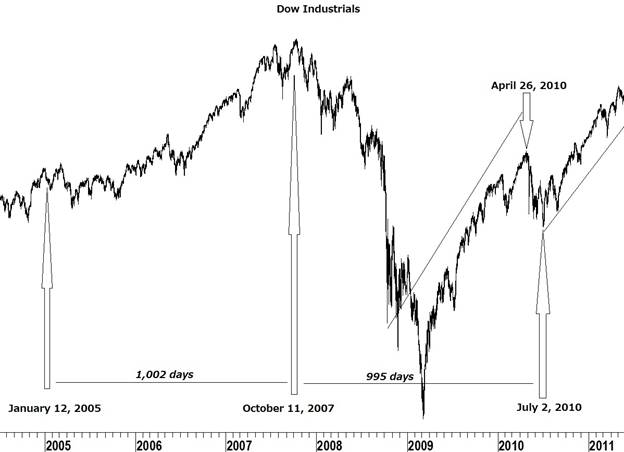
The advance between the November 2008 low and the April 2010 high was 498 days. 498 days fits into the time span of a subnormal basic advance. The Principle of Alternation guides us to expect the next advance (off the July 2010 low) to be either long or extended.
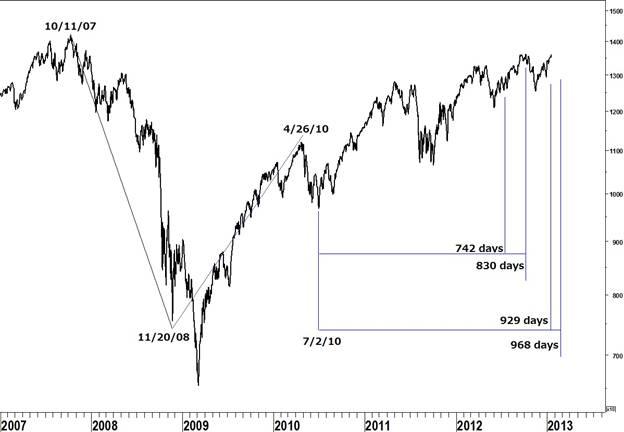
A long basic advance (742 – 830 days) targets the time period between July 13 and October 9, 2012 for an end to the bull market. An extended basic advance (929 – 968 days) targets the time period between January 16 and February 24 for the high. Both fit into the time span of the 15-year interval.
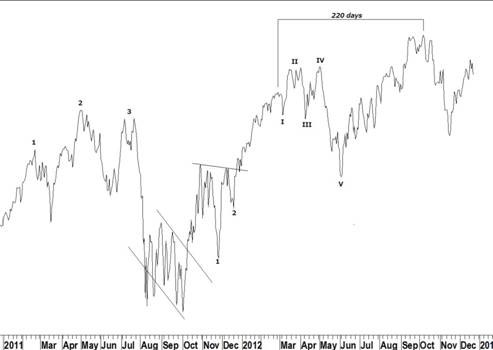
Lindsay’s best-known model, Three Peaks and Domed House, plays a role in the forecast. The descending base in September told us to expect a long domed house and that taking the count from the base, as is commonly done, would have come up short of the market top. In such a case we must count from an inflection point in the First Floor Roof (the five-wave reversal). Counting from the top of the first reversal on February 28, 2012 gave us an almost perfect count of 220 days to the October top. As that date synched well with a long basic advance of 826 days from the July 2010 low I originally thought that date was the high of the bull market. But the possibility that the bull market could extend until the time period of an extended basic advance (929-968 days) was always with us.
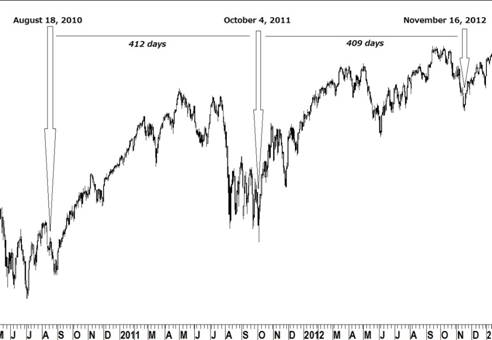
After the October high, a descending middle section pointed to the low of November 16, 2012. Point E of a descending middle section on August 18, 2010 counts 412 days to the low of October 4, 2011. The November 2012 low lay 409 days later. While it was safe to say this would be a “tradable” low, the question of whether to expect a new high in the Dow was still unanswered.
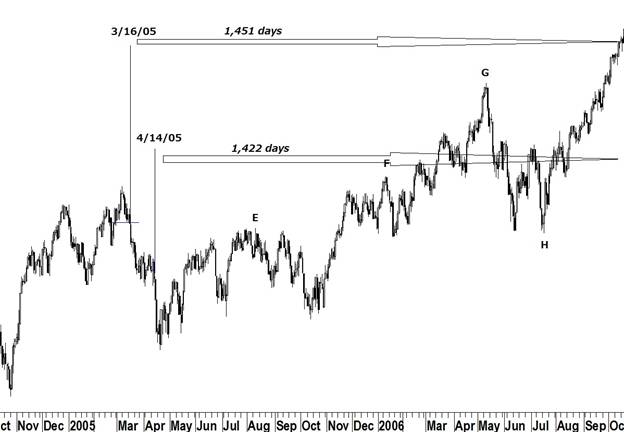
A middle section from early 2005 has two possible measuring points; point C on 4/14/05 counts 1,422 days to the major low on 3/6/09. Last Friday, 1/25/13 is 1,421 days after the 2009 low. Another possible point C on 3/16/05 counts 1,451 days to the March 2009 low. Counting an equidistance forward targets a possible high on 2/24/13. Both counts fit the period identified by an extended basic advance and the 15-year interval.
Ed Carlson, C.M.T.
Ed Carlson, author of George Lindsay and the Art of Technical Analysis, and his new book, George Lindsay's An Aid to Timing, is an independent trader, consultant, and Chartered Market Technician (CMT) based in Seattle. Carlson writes a weekly column for TraderPlanet.com, and manages the website Seattle Technical Advisors.com, where he publishes daily and weekly commentary. He spent twenty years as a stockbroker and holds an M.B.A. from Wichita State University.
© 2013 Copyright Ed Carlson - All Rights Reserved
Disclaimer: The above is a matter of opinion provided for general information purposes only and is not intended as investment advice. Information and analysis above are derived from sources and utilising methods believed to be reliable, but we cannot accept responsibility for any losses you may incur as a result of this analysis. Individuals should consult with their personal financial advisors.
© 2005-2022 http://www.MarketOracle.co.uk - The Market Oracle is a FREE Daily Financial Markets Analysis & Forecasting online publication.