Trading Opportunities - Understanding How Moving Averages Work
InvestorEducation / Learn to Trade Jan 28, 2013 - 08:04 PM GMTBy: EWI
 Moving averages are a popular tool for technical traders because they can "smooth" price fluctuations in any chart. EWI Senior Analyst Jeffrey Kennedy gives a clear definition:
"A moving average is simply the average value of data over a specified time period, and it is used to figure out whether the price of a stock or commodity is trending up or down... one way to think of a moving average is that it's an automated trend line."
Moving averages are both easy to create and extraordinarily dynamic. You can choose which time frame to study as well as which data points to use (open, high, low, close or midpoint of a trading range).
Jeffrey Kennedy shares 3 of the most popular moving averages in this excerpt is from his 10-page eBook: How to Trade the Highest Probability Opportunities: Moving Averages. Learn how you can download the entire eBook here >>
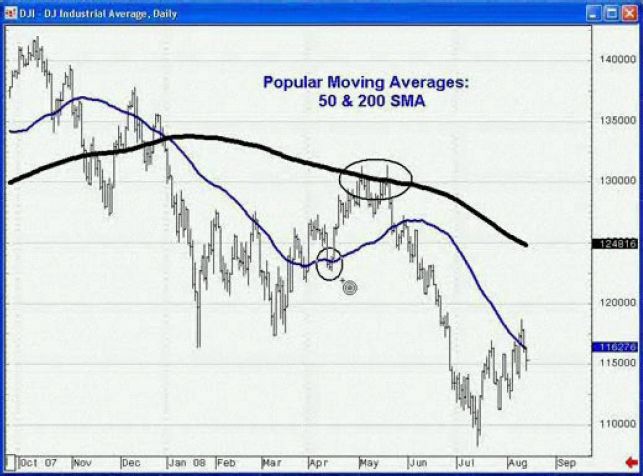
Let's begin with the most commonly-used moving averages among market technicians: the 50- and 200-day simple moving averages. These two trend lines often serve as areas of resistance or support.
For example, the chart below shows the circled areas where the 200-period SMA provided resistance in an April-to-May upward move in the DJIA (top circle on the heavy black line), and the 50-period SMA provided support (lower circle on the blue line).

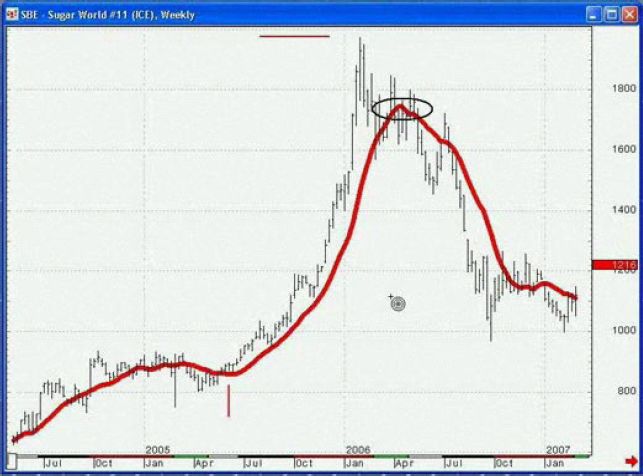
The 13-period SMA is a widely used simple moving average that works equally well in commodities, currencies, and stocks. In the sugar chart below, prices crossed the line (marked by the short, red vertical line), and that cross led to a substantial rally. This chart also shows a whipsaw in the market, which is circled:

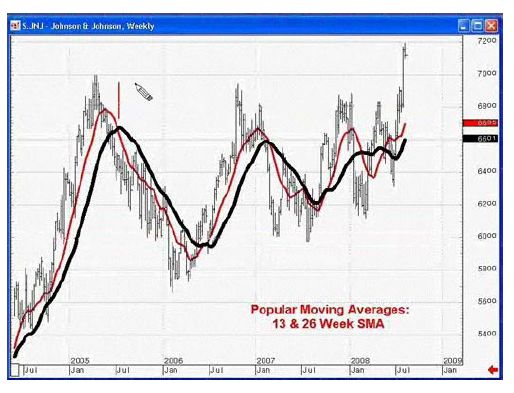
Another popular moving average setting that many people work with is the 13- and the 26-period moving averages in tandem. The figure below shows a crossover system, using a 13-week and a 26-week simple moving average of the close on a 2004 stock chart of Johnson & Johnson. Obviously, the number 26 is two times 13:

During this four-year period, the range in this stock was a little over $20.00, which is not much price appreciation. This dual moving average system worked well in a relatively bad market by identifying a number of buyside and sellside trading opportunities.
|
© 2005-2022 http://www.MarketOracle.co.uk - The Market Oracle is a FREE Daily Financial Markets Analysis & Forecasting online publication.


