


Is The Gold Tide Now Turning?
Commodities / Gold and Silver 2013 Jan 28, 2013 - 10:58 AM GMTBy: Brian_Bloom

 An open mind is essential for economic survival in today’s fast changing world – but one should be conscious of the potential for being attracted to arguments that lead to prejudicial outcomes.
The chart below (courtesy stockcharts.com) is a 5% X 3 box reversal Point &Figure chart of the ratio of gold shares/gold price. I have chosen this scale for the purpose of identifying long term trends
Chart #1: 5% X 3 box reversal Point & Figure Chart of the ratio of $XAU (gold shares/$Gold (gold price)
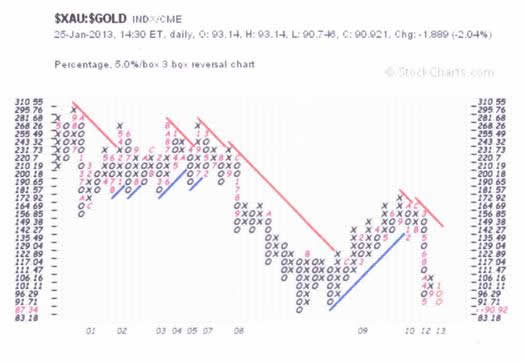
Clearly, in terms of this chart, the ratio of 87.34 represents the “ultimate” support level dating back 12 years. Equally clearly, if the support is penetrated on the downside, the ratio could fall precipitously. On the other hand, if the support level should hold, then this might evidence an impending turn in the gold tide.
Bearing in mind that this is a “ratio”, two alternatives are possible in context of a change in the trend:
- The gold price might fall even as the shares have bottomed
- The gold price might bottom or even start to rise – in which case the shares would represent an exceptional investment opportunity.
In the past two days I have received two separate analyses in my inbox – from highly respected analysts – calling for a rise in the gold shares:
- Quote from Tony Boeckh’s latest letter – January 24th: “Gold producers are looking particularly attractive” (WWW.BOECKHINVESTMENTLETTER.COM )
- Quote from Bob Moriarty’s analysis on January 25th : “In the next short while things will turn. The DOW and S&P are going to tumble; gold shares are going to rocket. Everyone loves the DOW, loves the S&P and hates gold.” (http://www.321gold.com/editorials/moriarty/moriarty012513.html )
Whilst both analysts believe that gold shares are going to rise, Tony is less bearish on large cap industrials than Bob.
The question arises: If gold bottoms around here and/or start to rise, why would it do so and how far might it rise?
Arguably, the above chart shows that gold shares have been leading the way. The fall since 2010 merely presaged a consolidation/pullback of the gold price. As an analytical starting point, if the ratio rises, this might be attributed to the market expressing its view that the gold price has stopped falling for the time being. Under those circumstances, the ratio might easily double – without the gold price rising to new heights.
The following chart – also courtesy stockcharts.com – shows that the gold price has (tentatively) broken above the “last” Fibonacci (blue) resistance level:
Chart #2: Weekly bar chart of the gold price including Fibonacci resistance levels (blue) and key trend lines (green)
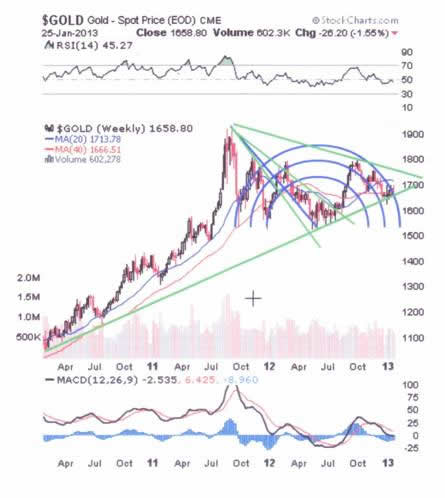
Important observations that arise from the above chart are as follows:
- The gold price is currently below its 20 week MA and above its 40 week MA – i.e. “indecision” still prevails
- The price broke above the resistance of the last Fibonacci semi circle but ended the week on a down note at the support of the rising green trend line
- The MACD histograms below the line have been contracting – indicating the possibility that the rising green trend line will probably hold
- There are three falling “fan” lines dating back to October 2011, and a final resolution of this formation is likely to emerge within the next quarter:
- If the gold price breaks above $1750, and then $1800, it is likely to continue rising to at least $1900
- If the gold price fails to break $1750, then a fall below $1700 will evidence a “failure” to break above the fan formation. In this case, the gold price might continue falling – to $1109 – as argued in previous articles.
Regardless of any indecision that will need to be resolved, it seems clear that the gold price is likely to rise during the coming three month period. Gold shares seem an attractive trading proposition.
Let’s put some perspective on this last statement. Below is a 3% X 3 box reversal chart of the $XAU
Chart #3: 3% X 3 Box reversal Point & Figure Chart of $XAU
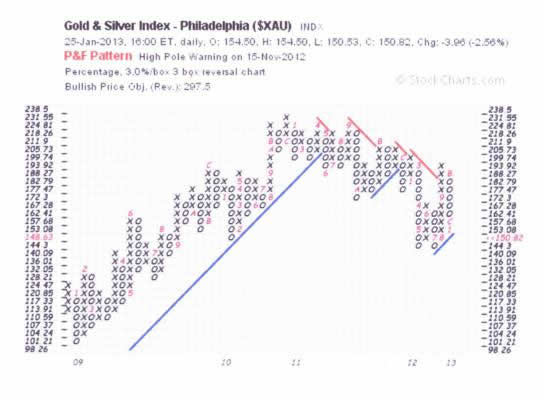
Although the prevailing trend line is “blue”, this is not a particularly bullish chart. Arguably, there is a rounding saucer top that dates back to late 2009.
The “iffiness” of all this discussion can be readily seen from the following monthly chart of the gold shares index that dates back to 1984 (courtesy DecisionPoint.com)
Chart #4 – Monthly Bar Chart of the $XAU
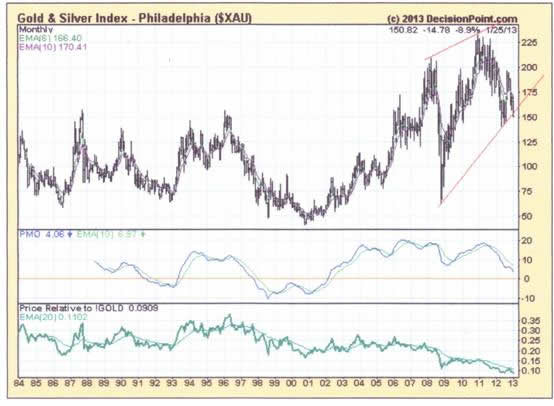
Clearly, from this chart, the share prices began to rise in earnest in 2002 but the PMO started giving warning signals in 2011 that the long term trend might have peaked. (Note that although the index rose to new highs, the PMO did not). Importantly, the PMO is still pointing down but we might see some support at the 150 level of the index as the PMO also encounters some support at the zero level.
Which brings us back to the “why?” question.
Ultimately, in the view of this analyst, the reason devolves to uncertainties surrounding the method/s by which the now $47 trillion sovereign debt overhang is going to be addressed. The two camps are still at odds. There are those who are adamant that the only course of action available to the authorities is to print their way out. The “other side” points to the fact that the impact on GDP per dollar of new money supply has been falling. There is literally no point in continuing down this road.
In this context, the recent resignation of Tim Geithner may be more easily understood. The following quote is from a recent article that reflects on his tenure:
“To his fans, he is the figure most responsible for stabilizing the banking system and preventing a catastrophic economic collapse. To his critics, he was excessively generous to bankers and failed to change a system where some banks remained “too big to fail.” (source: http://www.newrepublic.com/blog/112152/timothy-geithners-exit-interview )
Arguably, the simple reason that Geithner withdrew is that he ran out of ideas.
From a high level, it might also be argued that – if the $47 trillion sovereign debt level did not exist – the global economy might be facing boom times of extraordinary dimensions. The US economy is strengthening, the Chinese economy is strengthening (albeit the statistics may be “fudged”) and the natural gas energy paradigm is approaching critical mass in several countries. Further, the array of new technologies that are now emerging at the commercialisation phase is mind blowing. To get a taste of this, the reader might go to my website page at http://www.beyondneanderthal.com/mission-overview/ .
Unfortunately, the $47 trillion debt mountain does exist and the “next step” that United States (the world’s leading economy) takes will be critically important.
When one cuts through all the political posturing, one factor becomes clear: President Obama is now starting to face the reality of a need to at least talk in terms of balancing the budget. He has thrown so many rocks at the Republican led House of Representatives that it would be easy to be lulled into accepting that his views regarding how to handle this issue have not changed. Many people assume that he will continue down the road of bulldozing his ideas through. But the evidence does not support this conclusion.
In an interview with President Obama that appeared in today’s media at http://www.newrepublic.com/article/112190/obama-interview-2013-sit-down-president the following two quotes caught my eye:
- “I always read a lot of Lincoln, and I'm reminded of his adage that, with public opinion, there's nothing you can't accomplish; without it, you're not going to get very far.” From this it can be reasonably concluded that President Obama is starting to see the error of his tactic of trying to blindside the system. Arguably, he sees the recent federal appeals court ruling for what it was: a rap on the knuckles for trying to be too cute. (see: http://www.washingtonpost.com/politics/court-says-obama-exceeded-authority-in-making-appointments/2013/01/25/b7e1b692-6713-11e2-9e1b-07db1d2ccd5b_story.html for a report on that decision)
- “.. if we can get through this first period and arrive at a sensible package that reduces our deficits, stabilizes our debts, and involves smart reforms to Medicare and judicious spending cuts with some increased revenues and maybe tax reform, and you can get a package together that doesn't satisfy either Democrats or Republicans entirely, but puts us on a growth trajectory because it leaves enough spending on education, research and development, and infrastructure to boost growth now, but also deals with our long-term challenges on health care costs, then you can imagine the Republicans saying to themselves, "OK, we need to get on the side of the American majority on issues like immigration. We need to make progress on rebuilding our roads and bridges."
The reader’s attention is drawn to the words “this first period” (the period during which a decision needs to be made regarding US public debt limit) and “sensible package”. From this quote it seems clear that President Obama now fully understands the self defeating nature of “QE to infinity”.
Of course, whether the Industrial Equity Indices will rise to new highs or dither around within a trading range or collapse in a heap is still open to discussion, but the following chart should offer some context:
Chart #5 – Monthly Bar Chart of the $SPX
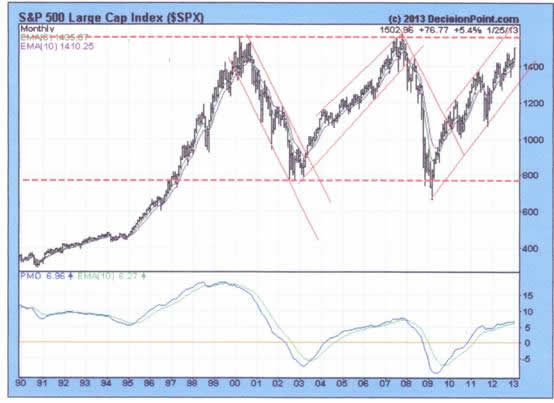
Clearly, the 1526 level represents significant resistance to further upside and the driver of any move to new heights will need to be extraordinarily powerful.
In the absence of QE to infinity, it seems reasonable to conclude that the headwinds associated with the world’s sovereign debt in general and the US’s public dent in particular are going to be too great.
Conclusion
The near term bounce in gold share prices – should it happen – is likely to be sufficiently strong to warrant taking a trading position, but it is likely to be short lived. When reality bites regarding the difficulties President Obama is going to experience in satisfying a hostile Congress and also in bringing the American public along with him as he steps back from his reliance on Executive Orders and clever tricks, a period of cold sobriety seems likely to emerge on the markets.
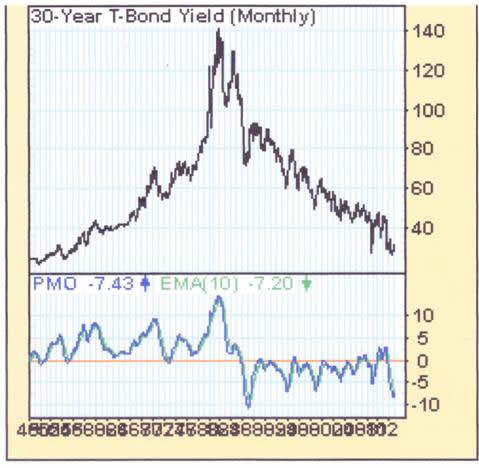
Note: As can be seen from the chart below, the debt level is not going to be the only headwind with which the US economy is going to need to cope. Interest rates look like they may be positioning for a spike. Note how the PMO is now rising from an historically low level and how the 30 year yield has broken up from a two year intermediate down trend.
Chart #6: Monthly chart of the US 30 year treasury yield (1948 – 2013)
Overall conclusion
The markets look more likely bat around within trading ranges than to enjoy any “spectacular” moves – either up or down. In particular, the anticipated gold universe up move seems more likely to be a damp squib than an upside explosion. The long term technical target for the gold price – of $1109 an ounce – still prevails.
Author, Beyond Neanderthal and The Last Finesse
Beyond Neanderthal and The Last Finesse are now available to purchase in e-book format, at under US$10 a copy, via almost 60 web based book retailers across the globe. In addition to Kindle, the entertaining, easy-to-read fact based adventure novels may also be downloaded on Kindle for PC, iPhone, iPod Touch, Blackberry, Nook, iPad and Adobe Digital Editions. Together, these two books offer a holistic right brain/left brain view of the current human condition, and of possibilities for a more positive future for humanity.
Copyright © 2013 Brian Bloom - All Rights Reserved
Disclaimer: The above is a matter of opinion provided for general information purposes only and is not intended as investment advice. Information and analysis above are derived from sources and utilising methods believed to be reliable, but we cannot accept responsibility for any losses you may incur as a result of this analysis. Individuals should consult with their personal financial advisors.
Brian Bloom Archive |
© 2005-2022 http://www.MarketOracle.co.uk - The Market Oracle is a FREE Daily Financial Markets Analysis & Forecasting online publication.