


Gold and Silver Miners Making Waves and New Trends
Commodities / Gold and Silver 2013 Jan 28, 2013 - 03:18 AM GMTBy: Chris_Vermeulen

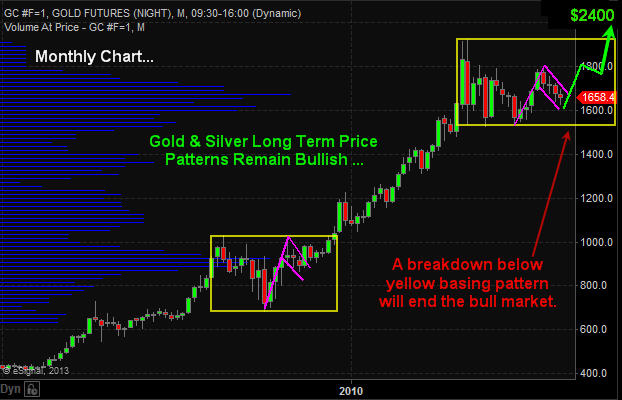
 The precious metals sector has been dormant since both gold and silver topped in 2011. But the long term bull market remains intact. As long as we do not have the price of gold close below the lower yellow box on the monthly chart then technical speaking precious metals should continue much higher.
Large consolidation periods (yellow boxes) provide investors with great insight for investments looking forward 6-18 months upon a breakout in either direction (up or down). The issue with investing during these times is the passage of time. One can hold a position for months and sometimes years having their investments fluctuate adding extra stress to their life when they really do not need to.
Once a breakout takes place a powerful rally or decline will start putting an investors’ money to work within days of committing to that particular investment compared to money invested waiting months for the breakout and new capital gains to occur.
Gold Price Chart – Monthly
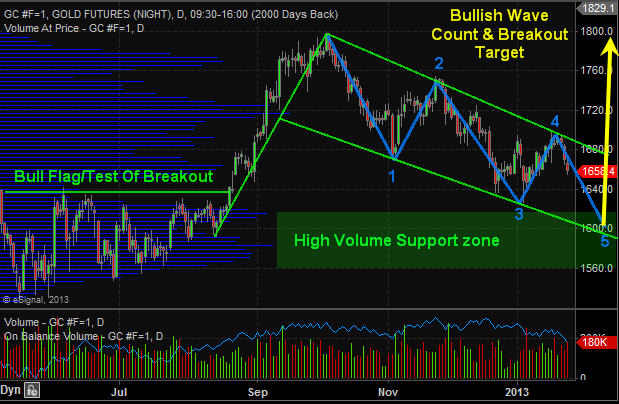
Gold Price Chart – Daily
The chart of gold continues to form a large bull flag pattern with a potential 3 or 5 wave correction. If price reverses this week and breaks above the upper resistance trend line then it will be a 3 (ABC) wave correction which is very bullish. But there is potential for a full 5 wave correction which is still bullish, but it just means we have another month or two before metals bottom.
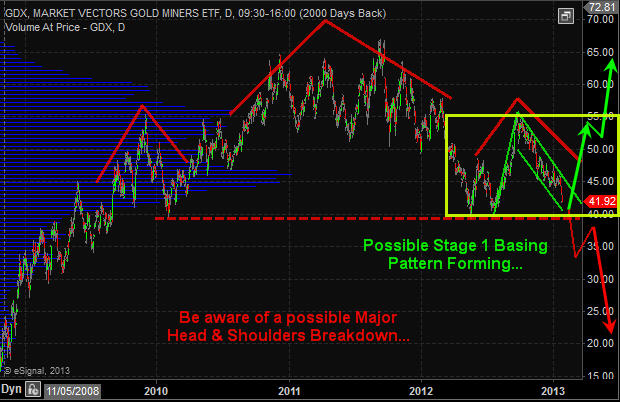
Gold Miner Stocks – GDX ETF Chart – Daily
Gold miners do not have the sexiest looking chart. It was formed a strong looking bull flag but has continues to correct and is not nearing a key support level. This level could act as a triple bottom (bullish) or if price breaks below then it would be breaking then neckline of a massive head and shoulders pattern which points to 50% decline. I remain bullish with the longer term gold trend until proven wrong.
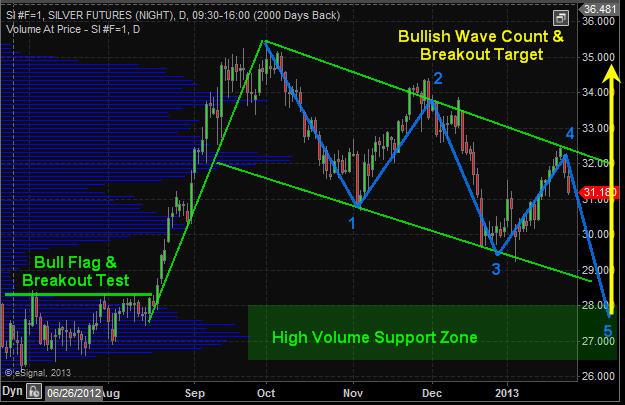
Silver Price Chart – Daily
Silver remains in a long term bull market much like the monthly chart of gold shown earlier in this report. Silver continues to work its way through a large bull flag pattern with a positive outlook at this time.
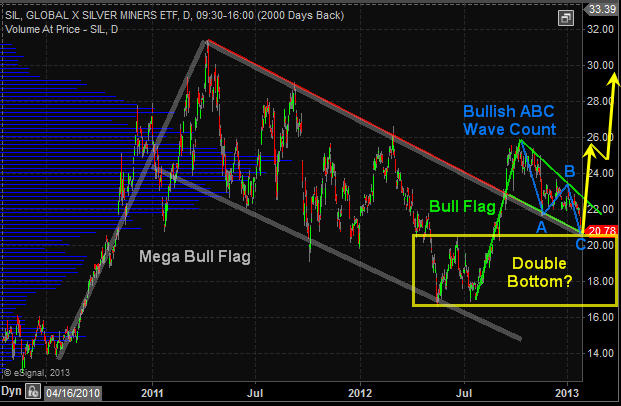
Silver Miner Stocks – SIL ETF – Daily Chart
Reviewing the precious metals sector it seems that silver miners have the sexiest looking chart. All price patterns are showing strength and are in proportion to one other. If this chart plays out to what technical analysis is pointing to then we could see the precious metals sector put in a bottom and rally within the next week or two. And if this is the case then silver miner stocks should provide the most opportunity going forward. Keep in mind you can view my actual watchlist of stock and ETFs I trade in real-time with my analysis free: https://stockcharts.com/public/1992897
Precious Metals Trading Conclusion:
In short, what you need to focus on is the yellow consolidation box on the monthly gold chart. A breaking in either direction will trigger a massive move that should last 6-18 months. Until then long term investors can simply sit back and watch the sector while they put their money to work in other active sectors.
From a short term traders point of view, that f mine. I am looking for a signs of a bottom on the daily chart to get my money working earlier to play the bounce/rally that takes place and actively managing the position until a breakout occurs. The charts overall are not that clear as to when a breakout will take place. Metals could start to rally next week or in a few months and all we can do is wait for a reversal to the upside before we get active.
Knowing the big picture trends and patterns at play
If you would like to keep up to date on market trends and trade ideas be sure to join my newsletter at http://www.thegoldandoilguy.com
By Chris Vermeulen
Please visit my website for more information. http://www.TheGoldAndOilGuy.com
Chris Vermeulen is Founder of the popular trading site TheGoldAndOilGuy.com. There he shares his highly successful, low-risk trading method. For 7 years Chris has been a leader in teaching others to skillfully trade in gold, oil, and silver in both bull and bear markets. Subscribers to his service depend on Chris' uniquely consistent investment opportunities that carry exceptionally low risk and high return.
This article is intended solely for information purposes. The opinions are those of the author only. Please conduct further research and consult your financial advisor before making any investment/trading decision. No responsibility can be accepted for losses that may result as a consequence of trading on the basis of this analysis.
Chris Vermeulen Archive |
© 2005-2022 http://www.MarketOracle.co.uk - The Market Oracle is a FREE Daily Financial Markets Analysis & Forecasting online publication.